Here's What Microequities Asset Management Group Limited's (ASX:MAM) P/E Is Telling Us

This article is for investors who would like to improve their understanding of price to earnings ratios (P/E ratios). To keep it practical, we'll show how Microequities Asset Management Group Limited's (ASX:MAM) P/E ratio could help you assess the value on offer. Microequities Asset Management Group has a price to earnings ratio of 18.55, based on the last twelve months. In other words, at today's prices, investors are paying A$18.55 for every A$1 in prior year profit.
View our latest analysis for Microequities Asset Management Group
How Do I Calculate A Price To Earnings Ratio?
The formula for P/E is:
Price to Earnings Ratio = Share Price ÷ Earnings per Share (EPS)
Or for Microequities Asset Management Group:
P/E of 18.55 = A$0.36 ÷ A$0.02 (Based on the trailing twelve months to June 2019.)
Is A High Price-to-Earnings Ratio Good?
A higher P/E ratio means that investors are paying a higher price for each A$1 of company earnings. All else being equal, it's better to pay a low price -- but as Warren Buffett said, 'It's far better to buy a wonderful company at a fair price than a fair company at a wonderful price.
Does Microequities Asset Management Group Have A Relatively High Or Low P/E For Its Industry?
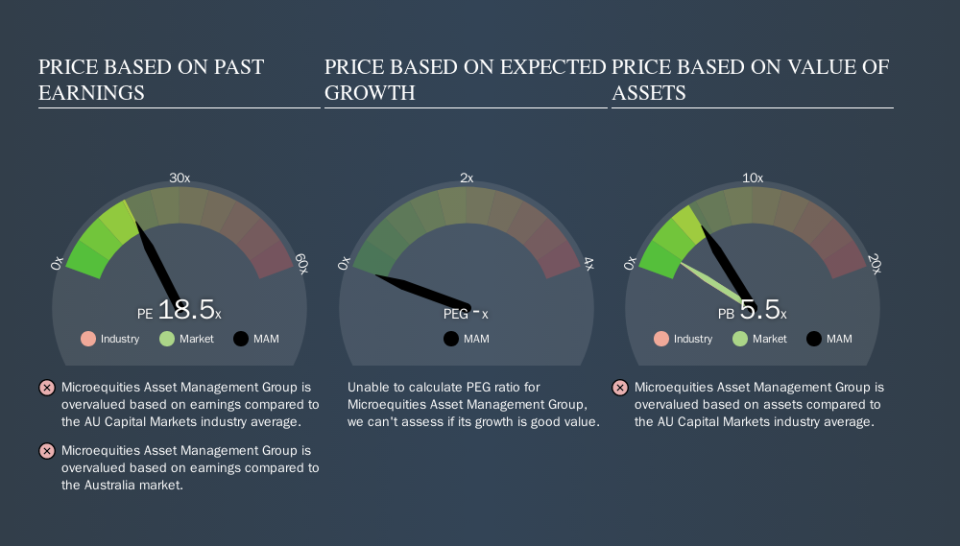
The P/E ratio indicates whether the market has higher or lower expectations of a company. You can see in the image below that the average P/E (18.3) for companies in the capital markets industry is roughly the same as Microequities Asset Management Group's P/E.
Its P/E ratio suggests that Microequities Asset Management Group shareholders think that in the future it will perform about the same as other companies in its industry classification. If the company has better than average prospects, then the market might be underestimating it. Checking factors such as director buying and selling. could help you form your own view on if that will happen.
How Growth Rates Impact P/E Ratios
Probably the most important factor in determining what P/E a company trades on is the earnings growth. When earnings grow, the 'E' increases, over time. Therefore, even if you pay a high multiple of earnings now, that multiple will become lower in the future. And as that P/E ratio drops, the company will look cheap, unless its share price increases.
Microequities Asset Management Group saw earnings per share decrease by 51% last year.
Don't Forget: The P/E Does Not Account For Debt or Bank Deposits
The 'Price' in P/E reflects the market capitalization of the company. Thus, the metric does not reflect cash or debt held by the company. Theoretically, a business can improve its earnings (and produce a lower P/E in the future) by investing in growth. That means taking on debt (or spending its cash).
While growth expenditure doesn't always pay off, the point is that it is a good option to have; but one that the P/E ratio ignores.
Microequities Asset Management Group's Balance Sheet
The extra options and safety that comes with Microequities Asset Management Group's AU$4.7m net cash position means that it deserves a higher P/E than it would if it had a lot of net debt.
The Bottom Line On Microequities Asset Management Group's P/E Ratio
Microequities Asset Management Group has a P/E of 18.5. That's around the same as the average in the AU market, which is 18.2. Although the recent drop in earnings per share would keep the market cautious, the net cash position means it's not surprising that expectations put the company roughly in line with the market average P/E.
Investors should be looking to buy stocks that the market is wrong about. As value investor Benjamin Graham famously said, 'In the short run, the market is a voting machine but in the long run, it is a weighing machine. Although we don't have analyst forecasts shareholders might want to examine this detailed historical graph of earnings, revenue and cash flow.
Of course you might be able to find a better stock than Microequities Asset Management Group. So you may wish to see this free collection of other companies that have grown earnings strongly.
We aim to bring you long-term focused research analysis driven by fundamental data. Note that our analysis may not factor in the latest price-sensitive company announcements or qualitative material.
If you spot an error that warrants correction, please contact the editor at editorial-team@simplywallst.com. This article by Simply Wall St is general in nature. It does not constitute a recommendation to buy or sell any stock, and does not take account of your objectives, or your financial situation. Simply Wall St has no position in the stocks mentioned. Thank you for reading.

