Here's What Mount Gibson Iron Limited's (ASX:MGX) P/E Ratio Is Telling Us

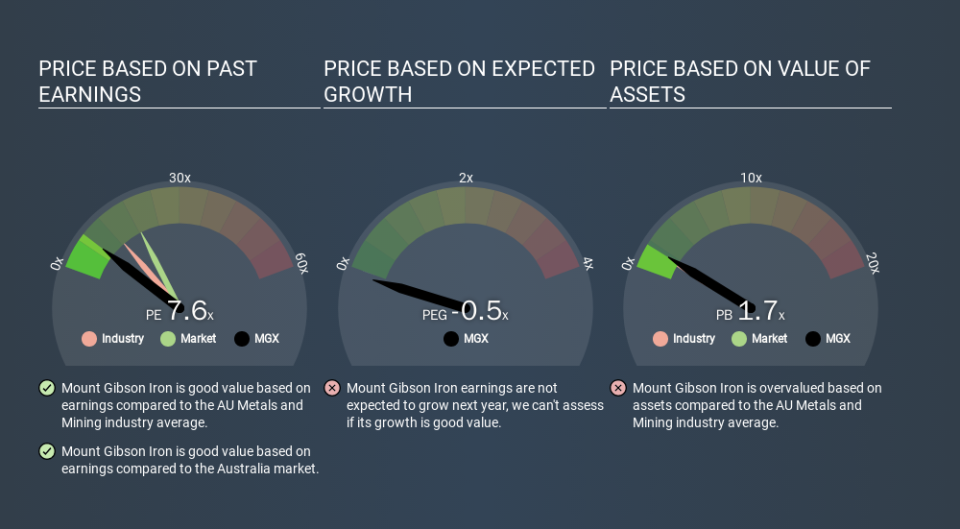
This article is written for those who want to get better at using price to earnings ratios (P/E ratios). To keep it practical, we'll show how Mount Gibson Iron Limited's (ASX:MGX) P/E ratio could help you assess the value on offer. Based on the last twelve months, Mount Gibson Iron's P/E ratio is 7.60. In other words, at today's prices, investors are paying A$7.60 for every A$1 in prior year profit.
Check out our latest analysis for Mount Gibson Iron
How Do I Calculate A Price To Earnings Ratio?
The formula for price to earnings is:
Price to Earnings Ratio = Price per Share ÷ Earnings per Share (EPS)
Or for Mount Gibson Iron:
P/E of 7.60 = A$0.91 ÷ A$0.12 (Based on the year to June 2019.)
Is A High P/E Ratio Good?
A higher P/E ratio means that buyers have to pay a higher price for each A$1 the company has earned over the last year. All else being equal, it's better to pay a low price -- but as Warren Buffett said, 'It's far better to buy a wonderful company at a fair price than a fair company at a wonderful price.
How Does Mount Gibson Iron's P/E Ratio Compare To Its Peers?
The P/E ratio indicates whether the market has higher or lower expectations of a company. If you look at the image below, you can see Mount Gibson Iron has a lower P/E than the average (12.6) in the metals and mining industry classification.
Mount Gibson Iron's P/E tells us that market participants think it will not fare as well as its peers in the same industry. Many investors like to buy stocks when the market is pessimistic about their prospects. You should delve deeper. I like to check if company insiders have been buying or selling.
How Growth Rates Impact P/E Ratios
Probably the most important factor in determining what P/E a company trades on is the earnings growth. If earnings are growing quickly, then the 'E' in the equation will increase faster than it would otherwise. And in that case, the P/E ratio itself will drop rather quickly. And as that P/E ratio drops, the company will look cheap, unless its share price increases.
It's nice to see that Mount Gibson Iron grew EPS by a stonking 32% in the last year. And earnings per share have improved by 7.7% annually, over the last five years. I'd therefore be a little surprised if its P/E ratio was not relatively high.
Don't Forget: The P/E Does Not Account For Debt or Bank Deposits
Don't forget that the P/E ratio considers market capitalization. That means it doesn't take debt or cash into account. In theory, a company can lower its future P/E ratio by using cash or debt to invest in growth.
Spending on growth might be good or bad a few years later, but the point is that the P/E ratio does not account for the option (or lack thereof).
So What Does Mount Gibson Iron's Balance Sheet Tell Us?
Mount Gibson Iron has net cash of AU$383m. This is fairly high at 36% of its market capitalization. That might mean balance sheet strength is important to the business, but should also help push the P/E a bit higher than it would otherwise be.
The Bottom Line On Mount Gibson Iron's P/E Ratio
Mount Gibson Iron has a P/E of 7.6. That's below the average in the AU market, which is 18.5. It grew its EPS nicely over the last year, and the healthy balance sheet implies there is more potential for growth. The relatively low P/E ratio implies the market is pessimistic.
Investors have an opportunity when market expectations about a stock are wrong. As value investor Benjamin Graham famously said, 'In the short run, the market is a voting machine but in the long run, it is a weighing machine. So this free visual report on analyst forecasts could hold the key to an excellent investment decision.
You might be able to find a better buy than Mount Gibson Iron. If you want a selection of possible winners, check out this free list of interesting companies that trade on a P/E below 20 (but have proven they can grow earnings).
If you spot an error that warrants correction, please contact the editor at editorial-team@simplywallst.com. This article by Simply Wall St is general in nature. It does not constitute a recommendation to buy or sell any stock, and does not take account of your objectives, or your financial situation. Simply Wall St has no position in the stocks mentioned.
We aim to bring you long-term focused research analysis driven by fundamental data. Note that our analysis may not factor in the latest price-sensitive company announcements or qualitative material. Thank you for reading.
