Here's What MVB Financial Corp.'s (NASDAQ:MVBF) P/E Ratio Is Telling Us

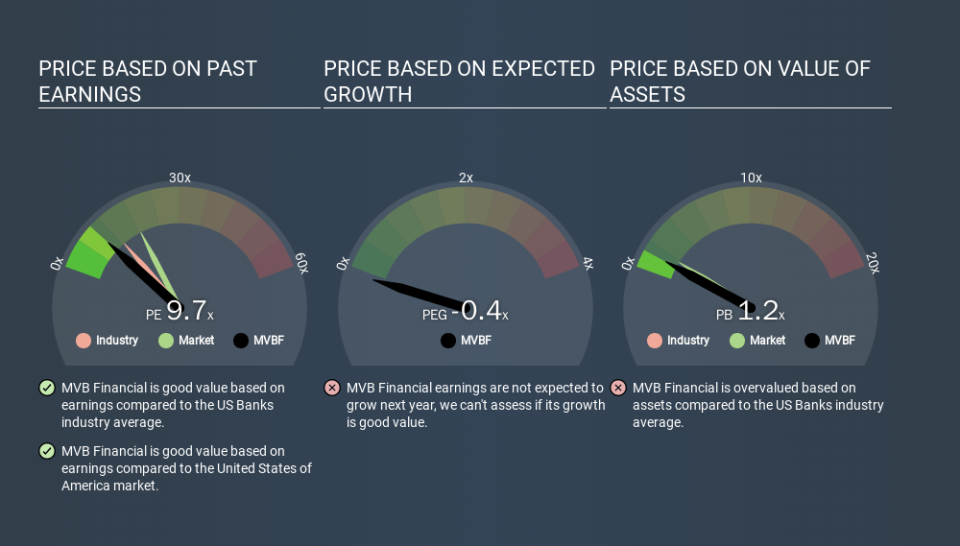
This article is for investors who would like to improve their understanding of price to earnings ratios (P/E ratios). We'll show how you can use MVB Financial Corp.'s (NASDAQ:MVBF) P/E ratio to inform your assessment of the investment opportunity. MVB Financial has a P/E ratio of 9.67, based on the last twelve months. In other words, at today's prices, investors are paying $9.67 for every $1 in prior year profit.
Check out our latest analysis for MVB Financial
How Do I Calculate A Price To Earnings Ratio?
The formula for price to earnings is:
Price to Earnings Ratio = Price per Share ÷ Earnings per Share (EPS)
Or for MVB Financial:
P/E of 9.67 = USD20.75 ÷ USD2.15 (Based on the year to September 2019.)
Is A High Price-to-Earnings Ratio Good?
A higher P/E ratio means that investors are paying a higher price for each USD1 of company earnings. That is not a good or a bad thing per se, but a high P/E does imply buyers are optimistic about the future.
Does MVB Financial Have A Relatively High Or Low P/E For Its Industry?
The P/E ratio indicates whether the market has higher or lower expectations of a company. The image below shows that MVB Financial has a lower P/E than the average (12.6) P/E for companies in the banks industry.
Its relatively low P/E ratio indicates that MVB Financial shareholders think it will struggle to do as well as other companies in its industry classification. While current expectations are low, the stock could be undervalued if the situation is better than the market assumes. It is arguably worth checking if insiders are buying shares, because that might imply they believe the stock is undervalued.
How Growth Rates Impact P/E Ratios
Generally speaking the rate of earnings growth has a profound impact on a company's P/E multiple. If earnings are growing quickly, then the 'E' in the equation will increase faster than it would otherwise. That means unless the share price increases, the P/E will reduce in a few years. A lower P/E should indicate the stock is cheap relative to others -- and that may attract buyers.
MVB Financial's 132% EPS improvement over the last year was like bamboo growth after rain; rapid and impressive. The sweetener is that the annual five year growth rate of 40% is also impressive. So I'd be surprised if the P/E ratio was not above average.
Remember: P/E Ratios Don't Consider The Balance Sheet
One drawback of using a P/E ratio is that it considers market capitalization, but not the balance sheet. So it won't reflect the advantage of cash, or disadvantage of debt. Hypothetically, a company could reduce its future P/E ratio by spending its cash (or taking on debt) to achieve higher earnings.
Such expenditure might be good or bad, in the long term, but the point here is that the balance sheet is not reflected by this ratio.
MVB Financial's Balance Sheet
MVB Financial has net debt worth 84% of its market capitalization. If you want to compare its P/E ratio to other companies, you should absolutely keep in mind it has significant borrowings.
The Verdict On MVB Financial's P/E Ratio
MVB Financial's P/E is 9.7 which is below average (18.4) in the US market. The company may have significant debt, but EPS growth was good last year. If it continues to grow, then the current low P/E may prove to be unjustified.
Investors have an opportunity when market expectations about a stock are wrong. If it is underestimating a company, investors can make money by buying and holding the shares until the market corrects itself. So this free visual report on analyst forecasts could hold the key to an excellent investment decision.
But note: MVB Financial may not be the best stock to buy. So take a peek at this free list of interesting companies with strong recent earnings growth (and a P/E ratio below 20).
If you spot an error that warrants correction, please contact the editor at editorial-team@simplywallst.com. This article by Simply Wall St is general in nature. It does not constitute a recommendation to buy or sell any stock, and does not take account of your objectives, or your financial situation. Simply Wall St has no position in the stocks mentioned.
We aim to bring you long-term focused research analysis driven by fundamental data. Note that our analysis may not factor in the latest price-sensitive company announcements or qualitative material. Thank you for reading.

