Here's How P/E Ratios Can Help Us Understand Chengdu Expressway Co., Ltd. (HKG:1785)

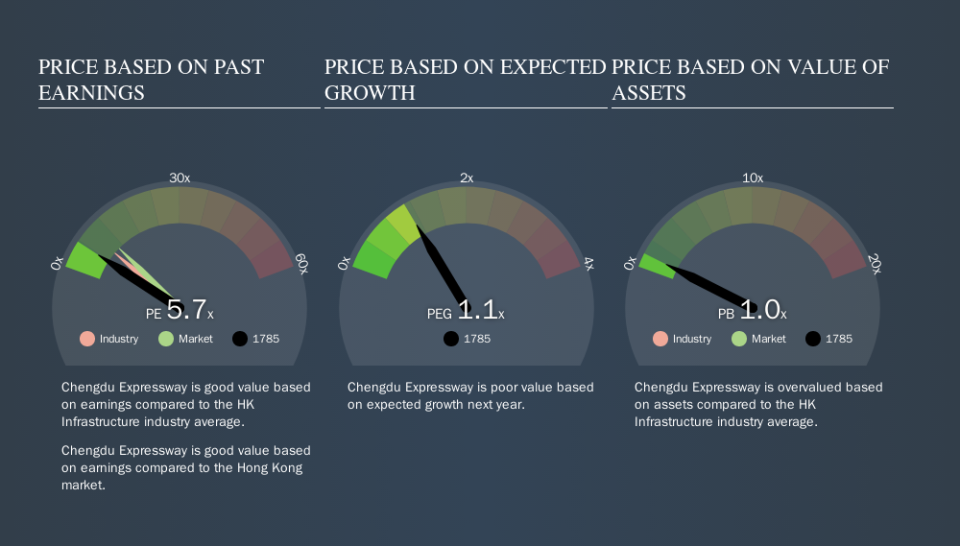
The goal of this article is to teach you how to use price to earnings ratios (P/E ratios). We'll show how you can use Chengdu Expressway Co., Ltd.'s (HKG:1785) P/E ratio to inform your assessment of the investment opportunity. What is Chengdu Expressway's P/E ratio? Well, based on the last twelve months it is 5.66. In other words, at today's prices, investors are paying HK$5.66 for every HK$1 in prior year profit.
View our latest analysis for Chengdu Expressway
How Do I Calculate A Price To Earnings Ratio?
The formula for P/E is:
Price to Earnings Ratio = Share Price (in reporting currency) ÷ Earnings per Share (EPS)
Or for Chengdu Expressway:
P/E of 5.66 = CN¥1.85 (Note: this is the share price in the reporting currency, namely, CNY ) ÷ CN¥0.33 (Based on the year to June 2019.)
Is A High Price-to-Earnings Ratio Good?
A higher P/E ratio means that investors are paying a higher price for each HK$1 of company earnings. That is not a good or a bad thing per se, but a high P/E does imply buyers are optimistic about the future.
How Does Chengdu Expressway's P/E Ratio Compare To Its Peers?
The P/E ratio indicates whether the market has higher or lower expectations of a company. The image below shows that Chengdu Expressway has a lower P/E than the average (8.7) P/E for companies in the infrastructure industry.
This suggests that market participants think Chengdu Expressway will underperform other companies in its industry. Many investors like to buy stocks when the market is pessimistic about their prospects. It is arguably worth checking if insiders are buying shares, because that might imply they believe the stock is undervalued.
How Growth Rates Impact P/E Ratios
Generally speaking the rate of earnings growth has a profound impact on a company's P/E multiple. If earnings are growing quickly, then the 'E' in the equation will increase faster than it would otherwise. And in that case, the P/E ratio itself will drop rather quickly. So while a stock may look expensive based on past earnings, it could be cheap based on future earnings.
Chengdu Expressway saw earnings per share improve by -6.0% last year. And earnings per share have improved by 9.9% annually, over the last five years.
A Limitation: P/E Ratios Ignore Debt and Cash In The Bank
One drawback of using a P/E ratio is that it considers market capitalization, but not the balance sheet. So it won't reflect the advantage of cash, or disadvantage of debt. Theoretically, a business can improve its earnings (and produce a lower P/E in the future) by investing in growth. That means taking on debt (or spending its cash).
While growth expenditure doesn't always pay off, the point is that it is a good option to have; but one that the P/E ratio ignores.
Is Debt Impacting Chengdu Expressway's P/E?
With net cash of CN¥684m, Chengdu Expressway has a very strong balance sheet, which may be important for its business. Having said that, at 23% of its market capitalization the cash hoard would contribute towards a higher P/E ratio.
The Bottom Line On Chengdu Expressway's P/E Ratio
Chengdu Expressway trades on a P/E ratio of 5.7, which is below the HK market average of 10.6. Recent earnings growth wasn't bad. And the net cash position gives the company many options. So it's strange that the low P/E indicates low expectations.
Investors should be looking to buy stocks that the market is wrong about. If it is underestimating a company, investors can make money by buying and holding the shares until the market corrects itself. So this free report on the analyst consensus forecasts could help you make a master move on this stock.
Of course, you might find a fantastic investment by looking at a few good candidates. So take a peek at this free list of companies with modest (or no) debt, trading on a P/E below 20.
We aim to bring you long-term focused research analysis driven by fundamental data. Note that our analysis may not factor in the latest price-sensitive company announcements or qualitative material.
If you spot an error that warrants correction, please contact the editor at editorial-team@simplywallst.com. This article by Simply Wall St is general in nature. It does not constitute a recommendation to buy or sell any stock, and does not take account of your objectives, or your financial situation. Simply Wall St has no position in the stocks mentioned. Thank you for reading.
