Here's How P/E Ratios Can Help Us Understand Bliss GVS Pharma Limited (NSE:BLISSGVS)

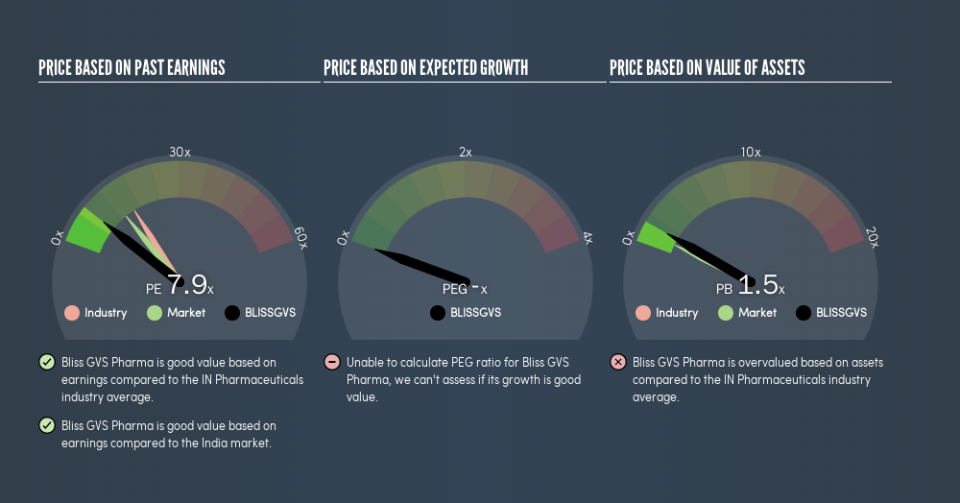
This article is written for those who want to get better at using price to earnings ratios (P/E ratios). We'll look at Bliss GVS Pharma Limited's (NSE:BLISSGVS) P/E ratio and reflect on what it tells us about the company's share price. Bliss GVS Pharma has a P/E ratio of 7.9, based on the last twelve months. In other words, at today's prices, investors are paying ₹7.9 for every ₹1 in prior year profit.
View our latest analysis for Bliss GVS Pharma
How Do You Calculate A P/E Ratio?
The formula for P/E is:
Price to Earnings Ratio = Share Price ÷ Earnings per Share (EPS)
Or for Bliss GVS Pharma:
P/E of 7.9 = ₹91.2 ÷ ₹11.55 (Based on the trailing twelve months to June 2019.)
Is A High P/E Ratio Good?
A higher P/E ratio means that investors are paying a higher price for each ₹1 of company earnings. All else being equal, it's better to pay a low price -- but as Warren Buffett said, 'It's far better to buy a wonderful company at a fair price than a fair company at a wonderful price.'
Does Bliss GVS Pharma Have A Relatively High Or Low P/E For Its Industry?
The P/E ratio indicates whether the market has higher or lower expectations of a company. The image below shows that Bliss GVS Pharma has a lower P/E than the average (16.2) P/E for companies in the pharmaceuticals industry.
This suggests that market participants think Bliss GVS Pharma will underperform other companies in its industry. While current expectations are low, the stock could be undervalued if the situation is better than the market assumes. You should delve deeper. I like to check if company insiders have been buying or selling.
How Growth Rates Impact P/E Ratios
Earnings growth rates have a big influence on P/E ratios. That's because companies that grow earnings per share quickly will rapidly increase the 'E' in the equation. And in that case, the P/E ratio itself will drop rather quickly. Then, a lower P/E should attract more buyers, pushing the share price up.
Bliss GVS Pharma's earnings made like a rocket, taking off 154% last year. The sweetener is that the annual five year growth rate of 24% is also impressive. With that kind of growth rate we would generally expect a high P/E ratio.
Don't Forget: The P/E Does Not Account For Debt or Bank Deposits
The 'Price' in P/E reflects the market capitalization of the company. That means it doesn't take debt or cash into account. Theoretically, a business can improve its earnings (and produce a lower P/E in the future) by investing in growth. That means taking on debt (or spending its cash).
While growth expenditure doesn't always pay off, the point is that it is a good option to have; but one that the P/E ratio ignores.
How Does Bliss GVS Pharma's Debt Impact Its P/E Ratio?
Bliss GVS Pharma has net cash of ₹98m. That should lead to a higher P/E than if it did have debt, because its strong balance sheets gives it more options.
The Verdict On Bliss GVS Pharma's P/E Ratio
Bliss GVS Pharma has a P/E of 7.9. That's below the average in the IN market, which is 13.3. It grew its EPS nicely over the last year, and the healthy balance sheet implies there is more potential for growth. The relatively low P/E ratio implies the market is pessimistic.
Investors have an opportunity when market expectations about a stock are wrong. As value investor Benjamin Graham famously said, 'In the short run, the market is a voting machine but in the long run, it is a weighing machine.' So this free report on the analyst consensus forecasts could help you make a master move on this stock.
You might be able to find a better buy than Bliss GVS Pharma. If you want a selection of possible winners, check out this free list of interesting companies that trade on a P/E below 20 (but have proven they can grow earnings).
We aim to bring you long-term focused research analysis driven by fundamental data. Note that our analysis may not factor in the latest price-sensitive company announcements or qualitative material.
If you spot an error that warrants correction, please contact the editor at editorial-team@simplywallst.com. This article by Simply Wall St is general in nature. It does not constitute a recommendation to buy or sell any stock, and does not take account of your objectives, or your financial situation. Simply Wall St has no position in the stocks mentioned. Thank you for reading.
