Here's How P/E Ratios Can Help Us Understand Silverlake Axis Ltd (SGX:5CP)

This article is for investors who would like to improve their understanding of price to earnings ratios (P/E ratios). To keep it practical, we'll show how Silverlake Axis Ltd's (SGX:5CP) P/E ratio could help you assess the value on offer. Silverlake Axis has a P/E ratio of 14.79, based on the last twelve months. In other words, at today's prices, investors are paying SGD14.79 for every SGD1 in prior year profit.
See our latest analysis for Silverlake Axis
How Do I Calculate A Price To Earnings Ratio?
The formula for P/E is:
Price to Earnings Ratio = Share Price (in reporting currency) ÷ Earnings per Share (EPS)
Or for Silverlake Axis:
P/E of 14.79 = SGD1.31 (Note: this is the share price in the reporting currency, namely, MYR ) ÷ SGD0.09 (Based on the trailing twelve months to September 2019.)
Is A High Price-to-Earnings Ratio Good?
A higher P/E ratio means that investors are paying a higher price for each SGD1 of company earnings. That is not a good or a bad thing per se, but a high P/E does imply buyers are optimistic about the future.
How Does Silverlake Axis's P/E Ratio Compare To Its Peers?
We can get an indication of market expectations by looking at the P/E ratio. The image below shows that Silverlake Axis has a lower P/E than the average (27.6) P/E for companies in the software industry.
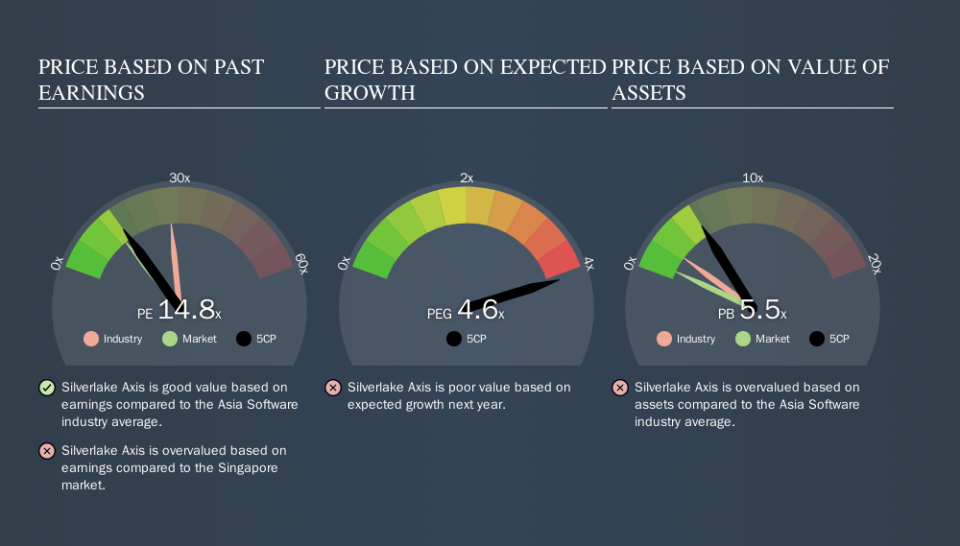
Silverlake Axis's P/E tells us that market participants think it will not fare as well as its peers in the same industry. Many investors like to buy stocks when the market is pessimistic about their prospects. It is arguably worth checking if insiders are buying shares, because that might imply they believe the stock is undervalued.
How Growth Rates Impact P/E Ratios
When earnings fall, the 'E' decreases, over time. That means even if the current P/E is low, it will increase over time if the share price stays flat. So while a stock may look cheap based on past earnings, it could be expensive based on future earnings.
Silverlake Axis increased earnings per share by a whopping 48% last year. In contrast, EPS has decreased by 1.5%, annually, over 5 years.
Don't Forget: The P/E Does Not Account For Debt or Bank Deposits
Don't forget that the P/E ratio considers market capitalization. That means it doesn't take debt or cash into account. The exact same company would hypothetically deserve a higher P/E ratio if it had a strong balance sheet, than if it had a weak one with lots of debt, because a cashed up company can spend on growth.
Such expenditure might be good or bad, in the long term, but the point here is that the balance sheet is not reflected by this ratio.
So What Does Silverlake Axis's Balance Sheet Tell Us?
With net cash of RM552m, Silverlake Axis has a very strong balance sheet, which may be important for its business. Having said that, at 16% of its market capitalization the cash hoard would contribute towards a higher P/E ratio.
The Bottom Line On Silverlake Axis's P/E Ratio
Silverlake Axis has a P/E of 14.8. That's higher than the average in its market, which is 13.2. Its net cash position is the cherry on top of its superb EPS growth. So based on this analysis we'd expect Silverlake Axis to have a high P/E ratio.
Investors have an opportunity when market expectations about a stock are wrong. As value investor Benjamin Graham famously said, 'In the short run, the market is a voting machine but in the long run, it is a weighing machine. So this free report on the analyst consensus forecasts could help you make a master move on this stock.
Of course, you might find a fantastic investment by looking at a few good candidates. So take a peek at this free list of companies with modest (or no) debt, trading on a P/E below 20.
We aim to bring you long-term focused research analysis driven by fundamental data. Note that our analysis may not factor in the latest price-sensitive company announcements or qualitative material.
If you spot an error that warrants correction, please contact the editor at editorial-team@simplywallst.com. This article by Simply Wall St is general in nature. It does not constitute a recommendation to buy or sell any stock, and does not take account of your objectives, or your financial situation. Simply Wall St has no position in the stocks mentioned. Thank you for reading.
