Here's How P/E Ratios Can Help Us Understand Manutan International SA (EPA:MAN)

Want to participate in a short research study? Help shape the future of investing tools and you could win a $250 gift card!
Today, we'll introduce the concept of the P/E ratio for those who are learning about investing. To keep it practical, we'll show how Manutan International SA's (EPA:MAN) P/E ratio could help you assess the value on offer. Manutan International has a P/E ratio of 12.33, based on the last twelve months. That is equivalent to an earnings yield of about 8.1%.
View our latest analysis for Manutan International
How Do I Calculate A Price To Earnings Ratio?
The formula for price to earnings is:
Price to Earnings Ratio = Share Price ÷ Earnings per Share (EPS)
Or for Manutan International:
P/E of 12.33 = €66.8 ÷ €5.42 (Based on the year to September 2018.)
Is A High Price-to-Earnings Ratio Good?
A higher P/E ratio implies that investors pay a higher price for the earning power of the business. All else being equal, it's better to pay a low price -- but as Warren Buffett said, 'It's far better to buy a wonderful company at a fair price than a fair company at a wonderful price.'
How Growth Rates Impact P/E Ratios
Probably the most important factor in determining what P/E a company trades on is the earnings growth. If earnings are growing quickly, then the 'E' in the equation will increase faster than it would otherwise. That means even if the current P/E is high, it will reduce over time if the share price stays flat. So while a stock may look expensive based on past earnings, it could be cheap based on future earnings.
Manutan International saw earnings per share improve by -5.4% last year. And its annual EPS growth rate over 5 years is 12%.
Does Manutan International Have A Relatively High Or Low P/E For Its Industry?
We can get an indication of market expectations by looking at the P/E ratio. The image below shows that Manutan International has a lower P/E than the average (23.2) P/E for companies in the online retail industry.
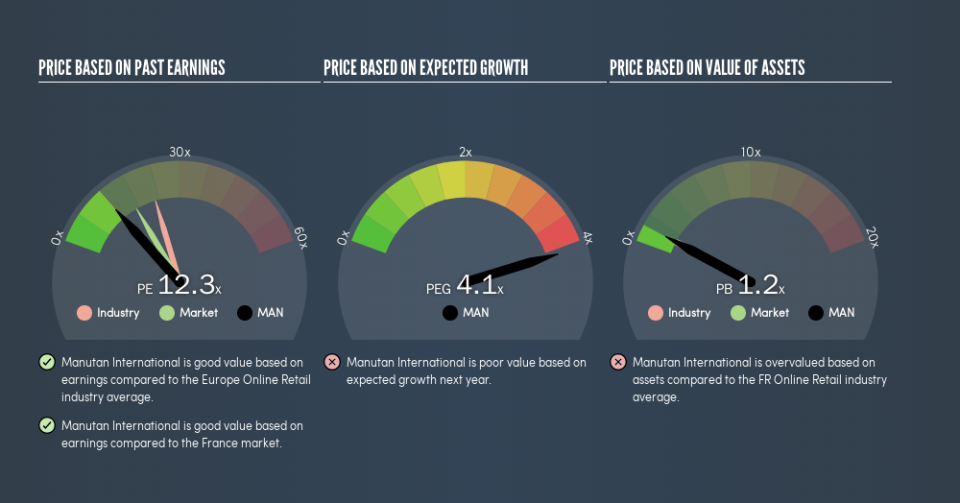
Its relatively low P/E ratio indicates that Manutan International shareholders think it will struggle to do as well as other companies in its industry classification. Since the market seems unimpressed with Manutan International, it's quite possible it could surprise on the upside. If you consider the stock interesting, further research is recommended. For example, I often monitor director buying and selling.
A Limitation: P/E Ratios Ignore Debt and Cash In The Bank
One drawback of using a P/E ratio is that it considers market capitalization, but not the balance sheet. So it won't reflect the advantage of cash, or disadvantage of debt. Theoretically, a business can improve its earnings (and produce a lower P/E in the future) by investing in growth. That means taking on debt (or spending its cash).
Such expenditure might be good or bad, in the long term, but the point here is that the balance sheet is not reflected by this ratio.
Is Debt Impacting Manutan International's P/E?
The extra options and safety that comes with Manutan International's €24m net cash position means that it deserves a higher P/E than it would if it had a lot of net debt.
The Bottom Line On Manutan International's P/E Ratio
Manutan International has a P/E of 12.3. That's below the average in the FR market, which is 17.1. Earnings improved over the last year. And the healthy balance sheet means the company can sustain growth while the P/E suggests shareholders don't think it will.
Investors have an opportunity when market expectations about a stock are wrong. As value investor Benjamin Graham famously said, 'In the short run, the market is a voting machine but in the long run, it is a weighing machine.' So this free visualization of the analyst consensus on future earnings could help you make the right decision about whether to buy, sell, or hold.
Of course, you might find a fantastic investment by looking at a few good candidates. So take a peek at this free list of companies with modest (or no) debt, trading on a P/E below 20.
We aim to bring you long-term focused research analysis driven by fundamental data. Note that our analysis may not factor in the latest price-sensitive company announcements or qualitative material.
If you spot an error that warrants correction, please contact the editor at editorial-team@simplywallst.com. This article by Simply Wall St is general in nature. It does not constitute a recommendation to buy or sell any stock, and does not take account of your objectives, or your financial situation. Simply Wall St has no position in the stocks mentioned. Thank you for reading.
