Here's How P/E Ratios Can Help Us Understand Monte Carlo Fashions Limited (NSE:MONTECARLO)

This article is written for those who want to get better at using price to earnings ratios (P/E ratios). To keep it practical, we'll show how Monte Carlo Fashions Limited's (NSE:MONTECARLO) P/E ratio could help you assess the value on offer. Looking at earnings over the last twelve months, Monte Carlo Fashions has a P/E ratio of 8.98. In other words, at today's prices, investors are paying ₹8.98 for every ₹1 in prior year profit.
See our latest analysis for Monte Carlo Fashions
How Do I Calculate A Price To Earnings Ratio?
The formula for price to earnings is:
Price to Earnings Ratio = Share Price ÷ Earnings per Share (EPS)
Or for Monte Carlo Fashions:
P/E of 8.98 = ₹239.60 ÷ ₹26.69 (Based on the trailing twelve months to June 2019.)
Is A High P/E Ratio Good?
A higher P/E ratio implies that investors pay a higher price for the earning power of the business. That is not a good or a bad thing per se, but a high P/E does imply buyers are optimistic about the future.
How Does Monte Carlo Fashions's P/E Ratio Compare To Its Peers?
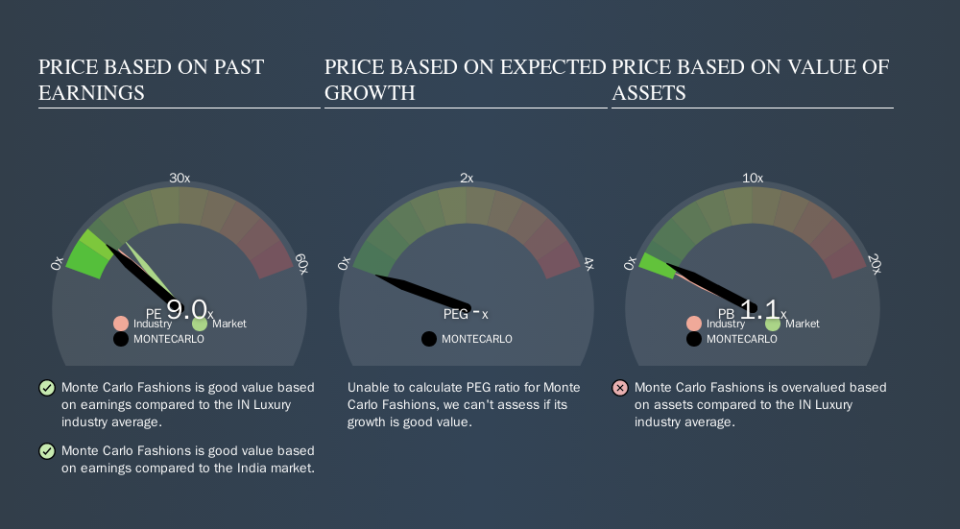
One good way to get a quick read on what market participants expect of a company is to look at its P/E ratio. If you look at the image below, you can see Monte Carlo Fashions has a lower P/E than the average (10.2) in the luxury industry classification.
Its relatively low P/E ratio indicates that Monte Carlo Fashions shareholders think it will struggle to do as well as other companies in its industry classification. Since the market seems unimpressed with Monte Carlo Fashions, it's quite possible it could surprise on the upside. If you consider the stock interesting, further research is recommended. For example, I often monitor director buying and selling.
How Growth Rates Impact P/E Ratios
When earnings fall, the 'E' decreases, over time. That means even if the current P/E is low, it will increase over time if the share price stays flat. A higher P/E should indicate the stock is expensive relative to others -- and that may encourage shareholders to sell.
Monte Carlo Fashions saw earnings per share decrease by 4.5% last year. But it has grown its earnings per share by 1.3% per year over the last five years.
A Limitation: P/E Ratios Ignore Debt and Cash In The Bank
The 'Price' in P/E reflects the market capitalization of the company. So it won't reflect the advantage of cash, or disadvantage of debt. The exact same company would hypothetically deserve a higher P/E ratio if it had a strong balance sheet, than if it had a weak one with lots of debt, because a cashed up company can spend on growth.
Spending on growth might be good or bad a few years later, but the point is that the P/E ratio does not account for the option (or lack thereof).
So What Does Monte Carlo Fashions's Balance Sheet Tell Us?
With net cash of ₹801m, Monte Carlo Fashions has a very strong balance sheet, which may be important for its business. Having said that, at 16% of its market capitalization the cash hoard would contribute towards a higher P/E ratio.
The Bottom Line On Monte Carlo Fashions's P/E Ratio
Monte Carlo Fashions has a P/E of 9.0. That's below the average in the IN market, which is 13.1. The recent drop in earnings per share would make investors cautious, the healthy balance sheet means the company retains potential for future growth. If that occurs, the current low P/E could prove to be temporary.
Investors should be looking to buy stocks that the market is wrong about. As value investor Benjamin Graham famously said, 'In the short run, the market is a voting machine but in the long run, it is a weighing machine. We don't have analyst forecasts, but you could get a better understanding of its growth by checking out this more detailed historical graph of earnings, revenue and cash flow.
Of course, you might find a fantastic investment by looking at a few good candidates. So take a peek at this free list of companies with modest (or no) debt, trading on a P/E below 20.
We aim to bring you long-term focused research analysis driven by fundamental data. Note that our analysis may not factor in the latest price-sensitive company announcements or qualitative material.
If you spot an error that warrants correction, please contact the editor at editorial-team@simplywallst.com. This article by Simply Wall St is general in nature. It does not constitute a recommendation to buy or sell any stock, and does not take account of your objectives, or your financial situation. Simply Wall St has no position in the stocks mentioned. Thank you for reading.
