Here's How P/E Ratios Can Help Us Understand Hugo Boss AG (ETR:BOSS)

Today, we'll introduce the concept of the P/E ratio for those who are learning about investing. We'll show how you can use Hugo Boss AG's (ETR:BOSS) P/E ratio to inform your assessment of the investment opportunity. Hugo Boss has a P/E ratio of 13.92, based on the last twelve months. That means that at current prices, buyers pay €13.92 for every €1 in trailing yearly profits.
Check out our latest analysis for Hugo Boss
How Do You Calculate A P/E Ratio?
The formula for P/E is:
Price to Earnings Ratio = Price per Share ÷ Earnings per Share (EPS)
Or for Hugo Boss:
P/E of 13.92 = €42.75 ÷ €3.07 (Based on the year to September 2019.)
Is A High Price-to-Earnings Ratio Good?
The higher the P/E ratio, the higher the price tag of a business, relative to its trailing earnings. That isn't necessarily good or bad, but a high P/E implies relatively high expectations of what a company can achieve in the future.
Does Hugo Boss Have A Relatively High Or Low P/E For Its Industry?
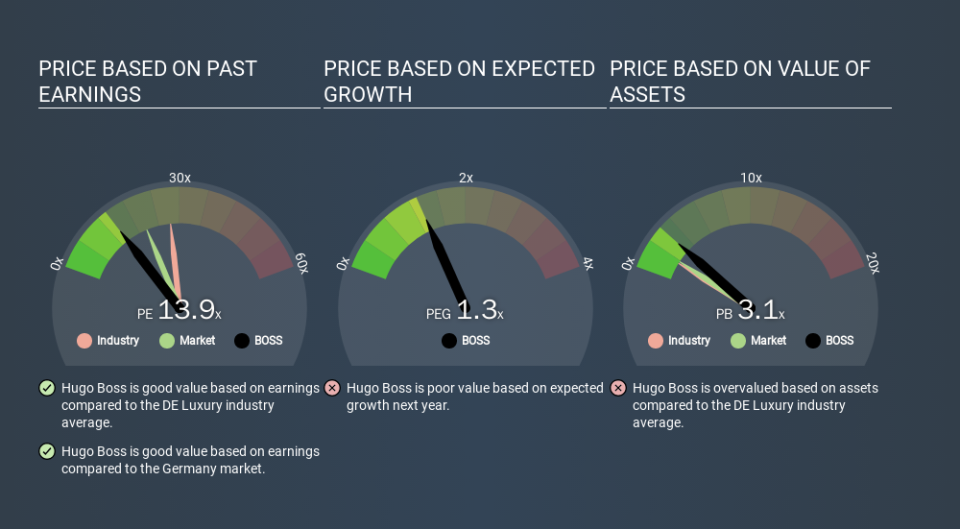
The P/E ratio essentially measures market expectations of a company. We can see in the image below that the average P/E (27.4) for companies in the luxury industry is higher than Hugo Boss's P/E.
This suggests that market participants think Hugo Boss will underperform other companies in its industry. While current expectations are low, the stock could be undervalued if the situation is better than the market assumes. If you consider the stock interesting, further research is recommended. For example, I often monitor director buying and selling.
How Growth Rates Impact P/E Ratios
If earnings fall then in the future the 'E' will be lower. Therefore, even if you pay a low multiple of earnings now, that multiple will become higher in the future. A higher P/E should indicate the stock is expensive relative to others -- and that may encourage shareholders to sell.
Hugo Boss saw earnings per share decrease by 1.2% last year. And over the longer term (5 years) earnings per share have decreased 9.1% annually. So we might expect a relatively low P/E.
Don't Forget: The P/E Does Not Account For Debt or Bank Deposits
The 'Price' in P/E reflects the market capitalization of the company. Thus, the metric does not reflect cash or debt held by the company. The exact same company would hypothetically deserve a higher P/E ratio if it had a strong balance sheet, than if it had a weak one with lots of debt, because a cashed up company can spend on growth.
Spending on growth might be good or bad a few years later, but the point is that the P/E ratio does not account for the option (or lack thereof).
How Does Hugo Boss's Debt Impact Its P/E Ratio?
Net debt totals just 6.0% of Hugo Boss's market cap. So it doesn't have as many options as it would with net cash, but its debt would not have much of an impact on its P/E ratio.
The Verdict On Hugo Boss's P/E Ratio
Hugo Boss has a P/E of 13.9. That's below the average in the DE market, which is 20.3. With only modest debt, it's likely the lack of EPS growth at least partially explains the pessimism implied by the P/E ratio.
Investors have an opportunity when market expectations about a stock are wrong. If the reality for a company is not as bad as the P/E ratio indicates, then the share price should increase as the market realizes this. So this free visualization of the analyst consensus on future earnings could help you make the right decision about whether to buy, sell, or hold.
You might be able to find a better buy than Hugo Boss. If you want a selection of possible winners, check out this free list of interesting companies that trade on a P/E below 20 (but have proven they can grow earnings).
If you spot an error that warrants correction, please contact the editor at editorial-team@simplywallst.com. This article by Simply Wall St is general in nature. It does not constitute a recommendation to buy or sell any stock, and does not take account of your objectives, or your financial situation. Simply Wall St has no position in the stocks mentioned.
We aim to bring you long-term focused research analysis driven by fundamental data. Note that our analysis may not factor in the latest price-sensitive company announcements or qualitative material. Thank you for reading.

