Here's How P/E Ratios Can Help Us Understand Gateley (Holdings) Plc (LON:GTLY)

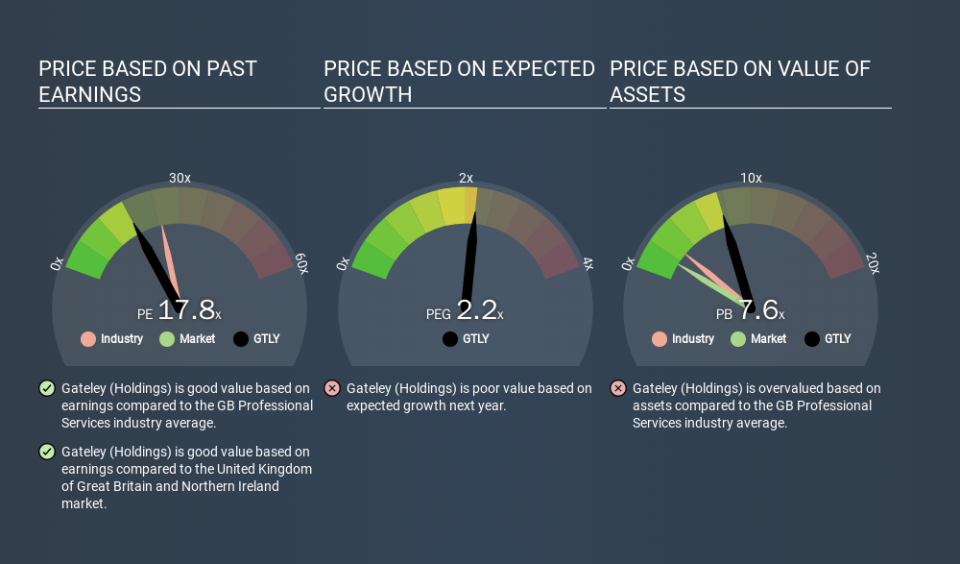
This article is for investors who would like to improve their understanding of price to earnings ratios (P/E ratios). We'll look at Gateley (Holdings) Plc's (LON:GTLY) P/E ratio and reflect on what it tells us about the company's share price. Based on the last twelve months, Gateley (Holdings)'s P/E ratio is 17.83. That is equivalent to an earnings yield of about 5.6%.
See our latest analysis for Gateley (Holdings)
How Do You Calculate A P/E Ratio?
The formula for price to earnings is:
Price to Earnings Ratio = Price per Share ÷ Earnings per Share (EPS)
Or for Gateley (Holdings):
P/E of 17.83 = £2.11 ÷ £0.12 (Based on the trailing twelve months to April 2019.)
Is A High P/E Ratio Good?
A higher P/E ratio means that buyers have to pay a higher price for each £1 the company has earned over the last year. All else being equal, it's better to pay a low price -- but as Warren Buffett said, 'It's far better to buy a wonderful company at a fair price than a fair company at a wonderful price'.
How Does Gateley (Holdings)'s P/E Ratio Compare To Its Peers?
The P/E ratio essentially measures market expectations of a company. The image below shows that Gateley (Holdings) has a lower P/E than the average (24.9) P/E for companies in the professional services industry.
Its relatively low P/E ratio indicates that Gateley (Holdings) shareholders think it will struggle to do as well as other companies in its industry classification. While current expectations are low, the stock could be undervalued if the situation is better than the market assumes. You should delve deeper. I like to check if company insiders have been buying or selling.
How Growth Rates Impact P/E Ratios
Probably the most important factor in determining what P/E a company trades on is the earnings growth. If earnings are growing quickly, then the 'E' in the equation will increase faster than it would otherwise. Therefore, even if you pay a high multiple of earnings now, that multiple will become lower in the future. And as that P/E ratio drops, the company will look cheap, unless its share price increases.
Gateley (Holdings) saw earnings per share improve by -7.2% last year. And earnings per share have improved by 13% annually, over the last three years.
A Limitation: P/E Ratios Ignore Debt and Cash In The Bank
One drawback of using a P/E ratio is that it considers market capitalization, but not the balance sheet. So it won't reflect the advantage of cash, or disadvantage of debt. Theoretically, a business can improve its earnings (and produce a lower P/E in the future) by investing in growth. That means taking on debt (or spending its cash).
Such expenditure might be good or bad, in the long term, but the point here is that the balance sheet is not reflected by this ratio.
How Does Gateley (Holdings)'s Debt Impact Its P/E Ratio?
Gateley (Holdings)'s net debt is 1.3% of its market cap. It would probably trade on a higher P/E ratio if it had a lot of cash, but I doubt it is having a big impact.
The Bottom Line On Gateley (Holdings)'s P/E Ratio
Gateley (Holdings) has a P/E of 17.8. That's around the same as the average in the GB market, which is 18.3. When you consider the modest EPS growth last year (along with some debt), it seems the market thinks the growth is sustainable.
Investors should be looking to buy stocks that the market is wrong about. If the reality for a company is not as bad as the P/E ratio indicates, then the share price should increase as the market realizes this. So this free visualization of the analyst consensus on future earnings could help you make the right decision about whether to buy, sell, or hold.
Of course you might be able to find a better stock than Gateley (Holdings). So you may wish to see this free collection of other companies that have grown earnings strongly.
If you spot an error that warrants correction, please contact the editor at editorial-team@simplywallst.com. This article by Simply Wall St is general in nature. It does not constitute a recommendation to buy or sell any stock, and does not take account of your objectives, or your financial situation. Simply Wall St has no position in the stocks mentioned.
We aim to bring you long-term focused research analysis driven by fundamental data. Note that our analysis may not factor in the latest price-sensitive company announcements or qualitative material. Thank you for reading.
