Here's How P/E Ratios Can Help Us Understand Cortland Bancorp (NASDAQ:CLDB)

Unfortunately for some shareholders, the Cortland Bancorp (NASDAQ:CLDB) share price has dived in the last thirty days. Indeed, the recent drop has reduced the annual gain to a relatively sedate 3.5% over the last twelve months.
Assuming no other changes, a sharply higher share price makes a stock less attractive to potential buyers. While the market sentiment towards a stock is very changeable, in the long run, the share price will tend to move in the same direction as earnings per share. So some would prefer to hold off buying when there is a lot of optimism towards a stock. One way to gauge market expectations of a stock is to look at its Price to Earnings Ratio (PE Ratio). Investors have optimistic expectations of companies with higher P/E ratios, compared to companies with lower P/E ratios.
Check out our latest analysis for Cortland Bancorp
How Does Cortland Bancorp's P/E Ratio Compare To Its Peers?
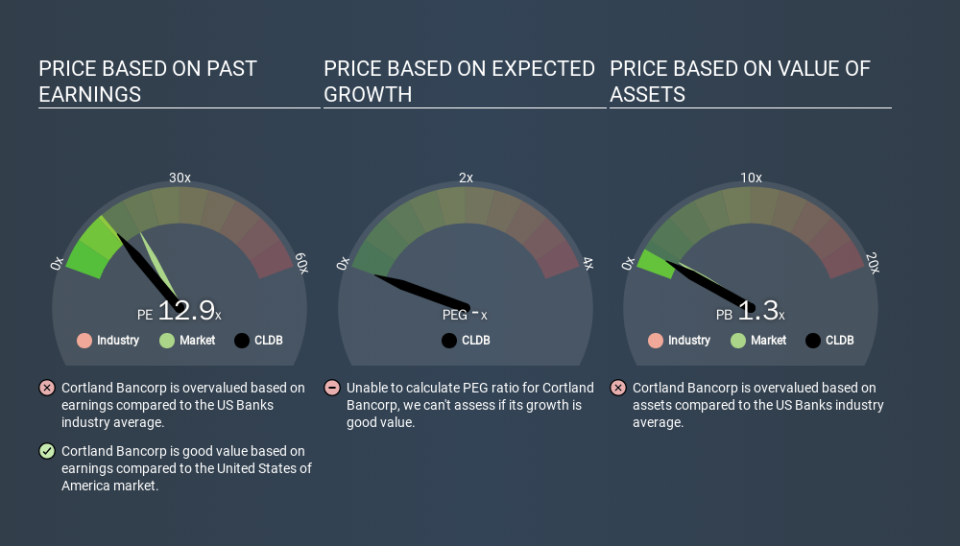
Cortland Bancorp has a P/E ratio of 12.90. As you can see below Cortland Bancorp has a P/E ratio that is fairly close for the average for the banks industry, which is 12.6.
Its P/E ratio suggests that Cortland Bancorp shareholders think that in the future it will perform about the same as other companies in its industry classification. If the company has better than average prospects, then the market might be underestimating it. Checking factors such as director buying and selling. could help you form your own view on if that will happen.
How Growth Rates Impact P/E Ratios
P/E ratios primarily reflect market expectations around earnings growth rates. When earnings grow, the 'E' increases, over time. And in that case, the P/E ratio itself will drop rather quickly. So while a stock may look expensive based on past earnings, it could be cheap based on future earnings.
Cortland Bancorp increased earnings per share by 9.3% last year. And it has bolstered its earnings per share by 22% per year over the last five years.
A Limitation: P/E Ratios Ignore Debt and Cash In The Bank
Don't forget that the P/E ratio considers market capitalization. Thus, the metric does not reflect cash or debt held by the company. The exact same company would hypothetically deserve a higher P/E ratio if it had a strong balance sheet, than if it had a weak one with lots of debt, because a cashed up company can spend on growth.
Such expenditure might be good or bad, in the long term, but the point here is that the balance sheet is not reflected by this ratio.
Cortland Bancorp's Balance Sheet
Cortland Bancorp's net debt is 5.1% of its market cap. So it doesn't have as many options as it would with net cash, but its debt would not have much of an impact on its P/E ratio.
The Verdict On Cortland Bancorp's P/E Ratio
Cortland Bancorp trades on a P/E ratio of 12.9, which is below the US market average of 18.3. The company does have a little debt, and EPS is moving in the right direction. If growth is sustainable over the long term, then the current P/E ratio may be a sign of good value. What can be absolutely certain is that the market has become less optimistic about Cortland Bancorp over the last month, with the P/E ratio falling from 12.9 back then to 12.9 today. For those who prefer to invest with the flow of momentum, that might be a bad sign, but for a contrarian, it may signal opportunity.
When the market is wrong about a stock, it gives savvy investors an opportunity. As value investor Benjamin Graham famously said, 'In the short run, the market is a voting machine but in the long run, it is a weighing machine. Although we don't have analyst forecasts you might want to assess this data-rich visualization of earnings, revenue and cash flow.
Of course, you might find a fantastic investment by looking at a few good candidates. So take a peek at this free list of companies with modest (or no) debt, trading on a P/E below 20.
If you spot an error that warrants correction, please contact the editor at editorial-team@simplywallst.com. This article by Simply Wall St is general in nature. It does not constitute a recommendation to buy or sell any stock, and does not take account of your objectives, or your financial situation. Simply Wall St has no position in the stocks mentioned.
We aim to bring you long-term focused research analysis driven by fundamental data. Note that our analysis may not factor in the latest price-sensitive company announcements or qualitative material. Thank you for reading.
