Here's How P/E Ratios Can Help Us Understand BMC Stock Holdings, Inc. (NASDAQ:BMCH)

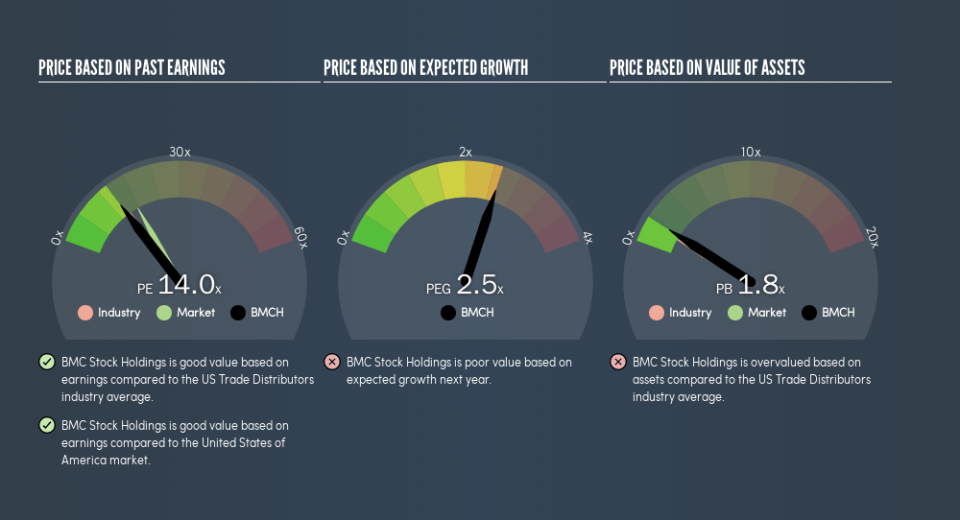
This article is written for those who want to get better at using price to earnings ratios (P/E ratios). To keep it practical, we'll show how BMC Stock Holdings, Inc.'s (NASDAQ:BMCH) P/E ratio could help you assess the value on offer. Based on the last twelve months, BMC Stock Holdings's P/E ratio is 13.98. That is equivalent to an earnings yield of about 7.2%.
Check out our latest analysis for BMC Stock Holdings
How Do I Calculate A Price To Earnings Ratio?
The formula for price to earnings is:
Price to Earnings Ratio = Price per Share ÷ Earnings per Share (EPS)
Or for BMC Stock Holdings:
P/E of 13.98 = $25.04 ÷ $1.79 (Based on the year to June 2019.)
Is A High Price-to-Earnings Ratio Good?
A higher P/E ratio means that buyers have to pay a higher price for each $1 the company has earned over the last year. All else being equal, it's better to pay a low price -- but as Warren Buffett said, 'It's far better to buy a wonderful company at a fair price than a fair company at a wonderful price.'
How Does BMC Stock Holdings's P/E Ratio Compare To Its Peers?
One good way to get a quick read on what market participants expect of a company is to look at its P/E ratio. As you can see below BMC Stock Holdings has a P/E ratio that is fairly close for the average for the trade distributors industry, which is 14.8.
BMC Stock Holdings's P/E tells us that market participants think its prospects are roughly in line with its industry. The company could surprise by performing better than average, in the future. I would further inform my view by checking insider buying and selling., among other things.
How Growth Rates Impact P/E Ratios
Probably the most important factor in determining what P/E a company trades on is the earnings growth. That's because companies that grow earnings per share quickly will rapidly increase the 'E' in the equation. And in that case, the P/E ratio itself will drop rather quickly. And as that P/E ratio drops, the company will look cheap, unless its share price increases.
It's nice to see that BMC Stock Holdings grew EPS by a stonking 31% in the last year. And it has bolstered its earnings per share by 26% per year over the last five years. I'd therefore be a little surprised if its P/E ratio was not relatively high.
A Limitation: P/E Ratios Ignore Debt and Cash In The Bank
Don't forget that the P/E ratio considers market capitalization. In other words, it does not consider any debt or cash that the company may have on the balance sheet. The exact same company would hypothetically deserve a higher P/E ratio if it had a strong balance sheet, than if it had a weak one with lots of debt, because a cashed up company can spend on growth.
While growth expenditure doesn't always pay off, the point is that it is a good option to have; but one that the P/E ratio ignores.
So What Does BMC Stock Holdings's Balance Sheet Tell Us?
Net debt totals 11% of BMC Stock Holdings's market cap. It would probably deserve a higher P/E ratio if it was net cash, since it would have more options for growth.
The Verdict On BMC Stock Holdings's P/E Ratio
BMC Stock Holdings's P/E is 14 which is below average (17.4) in the US market. The company hasn't stretched its balance sheet, and earnings growth was good last year. The low P/E ratio suggests current market expectations are muted, implying these levels of growth will not continue.
Investors should be looking to buy stocks that the market is wrong about. As value investor Benjamin Graham famously said, 'In the short run, the market is a voting machine but in the long run, it is a weighing machine.' So this free visualization of the analyst consensus on future earnings could help you make the right decision about whether to buy, sell, or hold.
But note: BMC Stock Holdings may not be the best stock to buy. So take a peek at this free list of interesting companies with strong recent earnings growth (and a P/E ratio below 20).
We aim to bring you long-term focused research analysis driven by fundamental data. Note that our analysis may not factor in the latest price-sensitive company announcements or qualitative material.
If you spot an error that warrants correction, please contact the editor at editorial-team@simplywallst.com. This article by Simply Wall St is general in nature. It does not constitute a recommendation to buy or sell any stock, and does not take account of your objectives, or your financial situation. Simply Wall St has no position in the stocks mentioned. Thank you for reading.
