Here's What PCSB Financial Corporation's (NASDAQ:PCSB) Shareholder Ownership Structure Looks Like

Every investor in PCSB Financial Corporation (NASDAQ:PCSB) should be aware of the most powerful shareholder groups. Institutions will often hold stock in bigger companies, and we expect to see insiders owning a noticeable percentage of the smaller ones. I quite like to see at least a little bit of insider ownership. As Charlie Munger said 'Show me the incentive and I will show you the outcome.
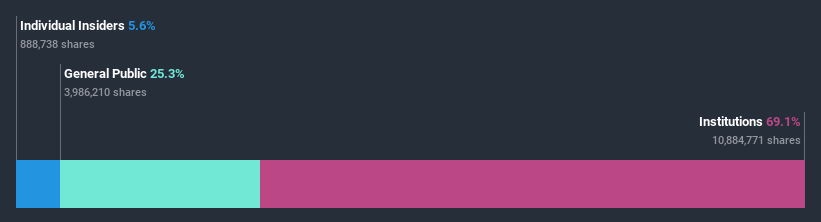
PCSB Financial is not a large company by global standards. It has a market capitalization of US$208m, which means it wouldn't have the attention of many institutional investors. In the chart below, we can see that institutional investors have bought into the company. Let's take a closer look to see what the different types of shareholder can tell us about PCSB Financial.
View our latest analysis for PCSB Financial
What Does The Institutional Ownership Tell Us About PCSB Financial?
Many institutions measure their performance against an index that approximates the local market. So they usually pay more attention to companies that are included in major indices.
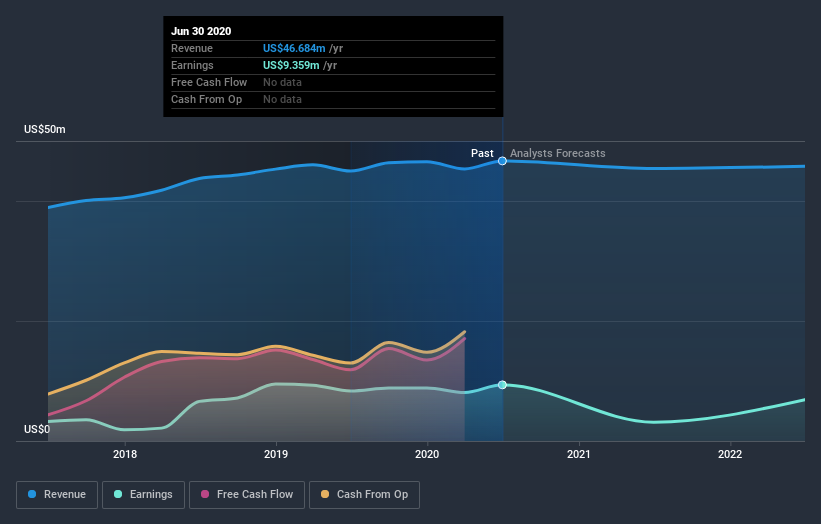
As you can see, institutional investors have a fair amount of stake in PCSB Financial. This implies the analysts working for those institutions have looked at the stock and they like it. But just like anyone else, they could be wrong. When multiple institutions own a stock, there's always a risk that they are in a 'crowded trade'. When such a trade goes wrong, multiple parties may compete to sell stock fast. This risk is higher in a company without a history of growth. You can see PCSB Financial's historic earnings and revenue, below, but keep in mind there's always more to the story.
Institutional investors own over 50% of the company, so together than can probably strongly influence board decisions. PCSB Financial is not owned by hedge funds. The company's largest shareholder is T. Rowe Price Group, Inc., with ownership of 10%. In comparison, the second and third largest shareholders hold about 9.1% and 7.2% of the stock. Furthermore, CEO Joseph Roberto is the owner of 0.0112242 of the company's shares.
A closer look at our ownership figures suggests that the top 12 shareholders have a combined ownership of 50% implying that no one share holder has a majority.
While it makes sense to study institutional ownership data for a company, it also makes sense to study analyst sentiments to know which way the wind is blowing. There is a little analyst coverage of the stock, but not much. So there is room for it to gain more coverage.
Insider Ownership Of PCSB Financial
The definition of an insider can differ slightly between different countries, but members of the board of directors always count. Company management run the business, but the CEO will answer to the board, even if he or she is a member of it.
I generally consider insider ownership to be a good thing. However, on some occasions it makes it more difficult for other shareholders to hold the board accountable for decisions.
I can report that insiders do own shares in PCSB Financial Corporation. As individuals, the insiders collectively own US$12m worth of the US$208m company. Some would say this shows alignment of interests between shareholders and the board. But it might be worth checking if those insiders have been selling.
General Public Ownership
The general public holds a 25% stake in PCSB. While this group can't necessarily call the shots, it can certainly have a real influence on how the company is run.
Next Steps:
I find it very interesting to look at who exactly owns a company. But to truly gain insight, we need to consider other information, too. To that end, you should be aware of the 1 warning sign we've spotted with PCSB Financial .
If you are like me, you may want to think about whether this company will grow or shrink. Luckily, you can check this free report showing analyst forecasts for its future.
NB: Figures in this article are calculated using data from the last twelve months, which refer to the 12-month period ending on the last date of the month the financial statement is dated. This may not be consistent with full year annual report figures.
This article by Simply Wall St is general in nature. It does not constitute a recommendation to buy or sell any stock, and does not take account of your objectives, or your financial situation. We aim to bring you long-term focused analysis driven by fundamental data. Note that our analysis may not factor in the latest price-sensitive company announcements or qualitative material. Simply Wall St has no position in any stocks mentioned.
Have feedback on this article? Concerned about the content? Get in touch with us directly. Alternatively, email editorial-team@simplywallst.com.

