Here's What Public Joint Stock Company Inter RAO UES's (MCX:IRAO) ROCE Can Tell Us

Today we are going to look at Public Joint Stock Company Inter RAO UES (MCX:IRAO) to see whether it might be an attractive investment prospect. In particular, we'll consider its Return On Capital Employed (ROCE), as that can give us insight into how profitably the company is able to employ capital in its business.
Firstly, we'll go over how we calculate ROCE. Second, we'll look at its ROCE compared to similar companies. And finally, we'll look at how its current liabilities are impacting its ROCE.
Return On Capital Employed (ROCE): What is it?
ROCE is a metric for evaluating how much pre-tax income (in percentage terms) a company earns on the capital invested in its business. All else being equal, a better business will have a higher ROCE. Ultimately, it is a useful but imperfect metric. Author Edwin Whiting says to be careful when comparing the ROCE of different businesses, since 'No two businesses are exactly alike.
So, How Do We Calculate ROCE?
The formula for calculating the return on capital employed is:
Return on Capital Employed = Earnings Before Interest and Tax (EBIT) ÷ (Total Assets - Current Liabilities)
Or for Inter RAO UES:
0.18 = ₽105b ÷ (₽738b - ₽148b) (Based on the trailing twelve months to June 2019.)
So, Inter RAO UES has an ROCE of 18%.
See our latest analysis for Inter RAO UES
Is Inter RAO UES's ROCE Good?
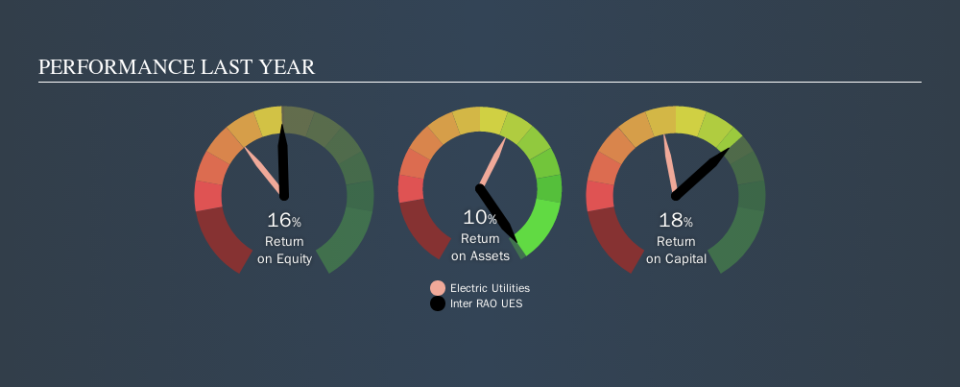
One way to assess ROCE is to compare similar companies. Using our data, we find that Inter RAO UES's ROCE is meaningfully better than the 9.2% average in the Electric Utilities industry. I think that's good to see, since it implies the company is better than other companies at making the most of its capital. Regardless of where Inter RAO UES sits next to its industry, its ROCE in absolute terms appears satisfactory, and this company could be worth a closer look.
We can see that, Inter RAO UES currently has an ROCE of 18% compared to its ROCE 3 years ago, which was 11%. This makes us think about whether the company has been reinvesting shrewdly. You can see in the image below how Inter RAO UES's ROCE compares to its industry. Click to see more on past growth.
It is important to remember that ROCE shows past performance, and is not necessarily predictive. ROCE can be deceptive for cyclical businesses, as returns can look incredible in boom times, and terribly low in downturns. ROCE is only a point-in-time measure. What happens in the future is pretty important for investors, so we have prepared a free report on analyst forecasts for Inter RAO UES.
What Are Current Liabilities, And How Do They Affect Inter RAO UES's ROCE?
Current liabilities are short term bills and invoices that need to be paid in 12 months or less. Due to the way ROCE is calculated, a high level of current liabilities makes a company look as though it has less capital employed, and thus can (sometimes unfairly) boost the ROCE. To counter this, investors can check if a company has high current liabilities relative to total assets.
Inter RAO UES has total assets of ₽738b and current liabilities of ₽148b. As a result, its current liabilities are equal to approximately 20% of its total assets. Current liabilities are minimal, limiting the impact on ROCE.
What We Can Learn From Inter RAO UES's ROCE
Overall, Inter RAO UES has a decent ROCE and could be worthy of further research. There might be better investments than Inter RAO UES out there, but you will have to work hard to find them . These promising businesses with rapidly growing earnings might be right up your alley.
If you like to buy stocks alongside management, then you might just love this free list of companies. (Hint: insiders have been buying them).
We aim to bring you long-term focused research analysis driven by fundamental data. Note that our analysis may not factor in the latest price-sensitive company announcements or qualitative material.
If you spot an error that warrants correction, please contact the editor at editorial-team@simplywallst.com. This article by Simply Wall St is general in nature. It does not constitute a recommendation to buy or sell any stock, and does not take account of your objectives, or your financial situation. Simply Wall St has no position in the stocks mentioned. Thank you for reading.

