Here's What Rexel S.A.'s (EPA:RXL) P/E Is Telling Us

The goal of this article is to teach you how to use price to earnings ratios (P/E ratios). We'll show how you can use Rexel S.A.'s (EPA:RXL) P/E ratio to inform your assessment of the investment opportunity. Rexel has a price to earnings ratio of 19.15, based on the last twelve months. That corresponds to an earnings yield of approximately 5.2%.
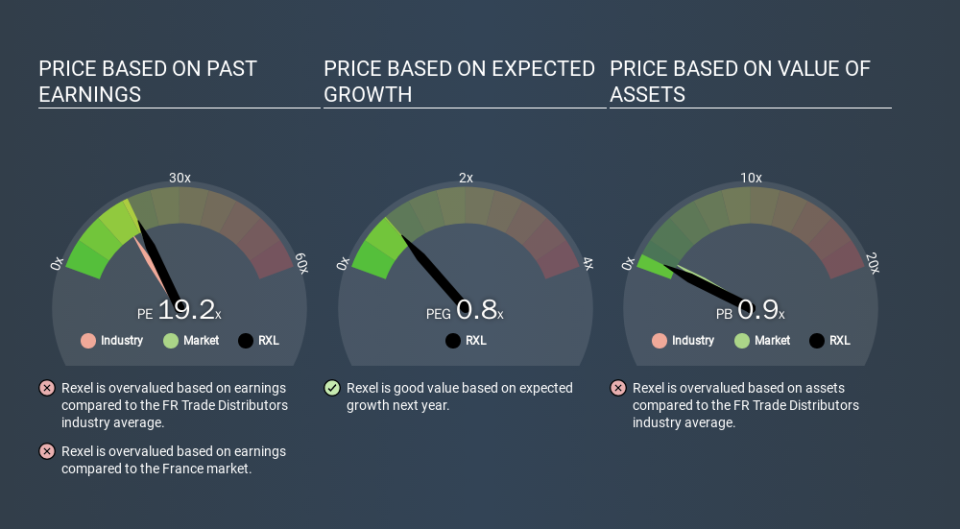
See our latest analysis for Rexel
How Do You Calculate A P/E Ratio?
The formula for price to earnings is:
Price to Earnings Ratio = Share Price ÷ Earnings per Share (EPS)
Or for Rexel:
P/E of 19.15 = EUR12.96 ÷ EUR0.68 (Based on the trailing twelve months to December 2019.)
Is A High Price-to-Earnings Ratio Good?
A higher P/E ratio implies that investors pay a higher price for the earning power of the business. All else being equal, it's better to pay a low price -- but as Warren Buffett said, 'It's far better to buy a wonderful company at a fair price than a fair company at a wonderful price'.
Does Rexel Have A Relatively High Or Low P/E For Its Industry?
The P/E ratio indicates whether the market has higher or lower expectations of a company. The image below shows that Rexel has a higher P/E than the average (16.0) P/E for companies in the trade distributors industry.
That means that the market expects Rexel will outperform other companies in its industry. Shareholders are clearly optimistic, but the future is always uncertain. So further research is always essential. I often monitor director buying and selling.
How Growth Rates Impact P/E Ratios
P/E ratios primarily reflect market expectations around earnings growth rates. If earnings are growing quickly, then the 'E' in the equation will increase faster than it would otherwise. That means unless the share price increases, the P/E will reduce in a few years. And as that P/E ratio drops, the company will look cheap, unless its share price increases.
In the last year, Rexel grew EPS like Taylor Swift grew her fan base back in 2010; the 53% gain was both fast and well deserved. Having said that, the average EPS growth over the last three years wasn't so good, coming in at 14%. Unfortunately, earnings per share are down 4.1% a year, over 5 years.
Don't Forget: The P/E Does Not Account For Debt or Bank Deposits
Don't forget that the P/E ratio considers market capitalization. Thus, the metric does not reflect cash or debt held by the company. In theory, a company can lower its future P/E ratio by using cash or debt to invest in growth.
Such expenditure might be good or bad, in the long term, but the point here is that the balance sheet is not reflected by this ratio.
How Does Rexel's Debt Impact Its P/E Ratio?
Rexel has net debt worth 50% of its market capitalization. This is enough debt that you'd have to make some adjustments before using the P/E ratio to compare it to a company with net cash.
The Verdict On Rexel's P/E Ratio
Rexel trades on a P/E ratio of 19.2, which is fairly close to the FR market average of 18.7. It does have enough debt to add risk, although earnings growth was strong in the last year. The P/E suggests the market isn't confident that growth will be sustained, though.
When the market is wrong about a stock, it gives savvy investors an opportunity. As value investor Benjamin Graham famously said, 'In the short run, the market is a voting machine but in the long run, it is a weighing machine. So this free visual report on analyst forecasts could hold the key to an excellent investment decision.
Of course you might be able to find a better stock than Rexel. So you may wish to see this free collection of other companies that have grown earnings strongly.
If you spot an error that warrants correction, please contact the editor at editorial-team@simplywallst.com. This article by Simply Wall St is general in nature. It does not constitute a recommendation to buy or sell any stock, and does not take account of your objectives, or your financial situation. Simply Wall St has no position in the stocks mentioned.
We aim to bring you long-term focused research analysis driven by fundamental data. Note that our analysis may not factor in the latest price-sensitive company announcements or qualitative material. Thank you for reading.
