Here's What Teckwah Industrial Corporation Ltd's (SGX:561) P/E Ratio Is Telling Us

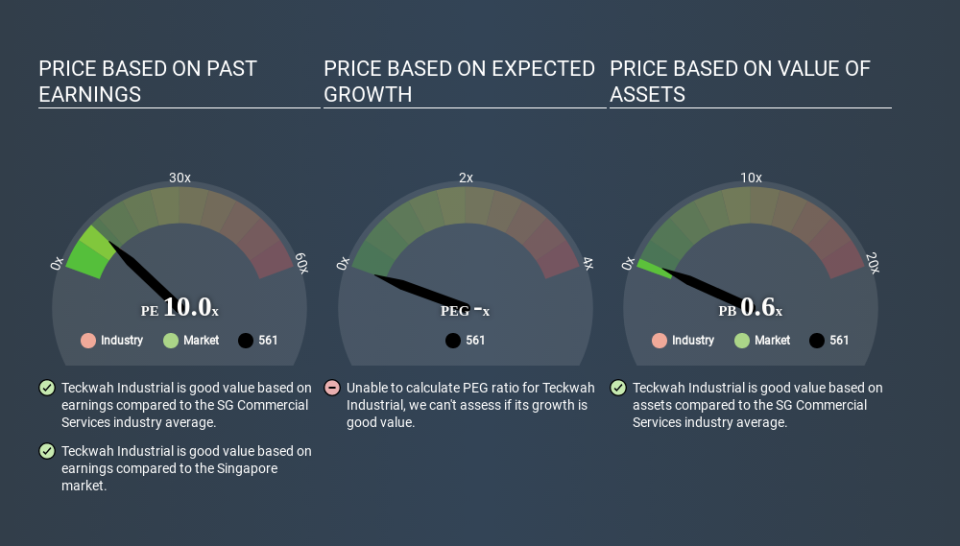
Today, we'll introduce the concept of the P/E ratio for those who are learning about investing. We'll look at Teckwah Industrial Corporation Ltd's (SGX:561) P/E ratio and reflect on what it tells us about the company's share price. Teckwah Industrial has a P/E ratio of 10.03, based on the last twelve months. That means that at current prices, buyers pay SGD10.03 for every SGD1 in trailing yearly profits.
Check out our latest analysis for Teckwah Industrial
How Do I Calculate A Price To Earnings Ratio?
The formula for price to earnings is:
Price to Earnings Ratio = Price per Share ÷ Earnings per Share (EPS)
Or for Teckwah Industrial:
P/E of 10.03 = SGD0.385 ÷ SGD0.038 (Based on the year to December 2019.)
(Note: the above calculation results may not be precise due to rounding.)
Is A High Price-to-Earnings Ratio Good?
A higher P/E ratio means that buyers have to pay a higher price for each SGD1 the company has earned over the last year. That is not a good or a bad thing per se, but a high P/E does imply buyers are optimistic about the future.
Does Teckwah Industrial Have A Relatively High Or Low P/E For Its Industry?
The P/E ratio indicates whether the market has higher or lower expectations of a company. As you can see below Teckwah Industrial has a P/E ratio that is fairly close for the average for the commercial services industry, which is 10.6.
Teckwah Industrial's P/E tells us that market participants think its prospects are roughly in line with its industry. If the company has better than average prospects, then the market might be underestimating it. Further research into factors such as insider buying and selling, could help you form your own view on whether that is likely.
How Growth Rates Impact P/E Ratios
Companies that shrink earnings per share quickly will rapidly decrease the 'E' in the equation. That means even if the current P/E is low, it will increase over time if the share price stays flat. So while a stock may look cheap based on past earnings, it could be expensive based on future earnings.
Notably, Teckwah Industrial grew EPS by a whopping 26% in the last year. In contrast, EPS has decreased by 13%, annually, over 3 years.
Don't Forget: The P/E Does Not Account For Debt or Bank Deposits
One drawback of using a P/E ratio is that it considers market capitalization, but not the balance sheet. That means it doesn't take debt or cash into account. The exact same company would hypothetically deserve a higher P/E ratio if it had a strong balance sheet, than if it had a weak one with lots of debt, because a cashed up company can spend on growth.
Such spending might be good or bad, overall, but the key point here is that you need to look at debt to understand the P/E ratio in context.
So What Does Teckwah Industrial's Balance Sheet Tell Us?
Teckwah Industrial has net cash of S$40m. This is fairly high at 45% of its market capitalization. That might mean balance sheet strength is important to the business, but should also help push the P/E a bit higher than it would otherwise be.
The Bottom Line On Teckwah Industrial's P/E Ratio
Teckwah Industrial trades on a P/E ratio of 10.0, which is fairly close to the SG market average of 10.2. Considering its recent growth, alongside its lack of debt, it would appear that the market isn't very excited about the future.
When the market is wrong about a stock, it gives savvy investors an opportunity. If it is underestimating a company, investors can make money by buying and holding the shares until the market corrects itself. Although we don't have analyst forecasts you might want to assess this data-rich visualization of earnings, revenue and cash flow.
Of course, you might find a fantastic investment by looking at a few good candidates. So take a peek at this free list of companies with modest (or no) debt, trading on a P/E below 20.
If you spot an error that warrants correction, please contact the editor at editorial-team@simplywallst.com. This article by Simply Wall St is general in nature. It does not constitute a recommendation to buy or sell any stock, and does not take account of your objectives, or your financial situation. Simply Wall St has no position in the stocks mentioned.
We aim to bring you long-term focused research analysis driven by fundamental data. Note that our analysis may not factor in the latest price-sensitive company announcements or qualitative material. Thank you for reading.
