Here's Why Grifal (BIT:GRAL) Can Manage Its Debt Responsibly

Legendary fund manager Li Lu (who Charlie Munger backed) once said, 'The biggest investment risk is not the volatility of prices, but whether you will suffer a permanent loss of capital. So it might be obvious that you need to consider debt, when you think about how risky any given stock is, because too much debt can sink a company. We note that Grifal S.p.A. (BIT:GRAL) does have debt on its balance sheet. But the more important question is: how much risk is that debt creating?
When Is Debt Dangerous?
Debt and other liabilities become risky for a business when it cannot easily fulfill those obligations, either with free cash flow or by raising capital at an attractive price. In the worst case scenario, a company can go bankrupt if it cannot pay its creditors. However, a more common (but still painful) scenario is that it has to raise new equity capital at a low price, thus permanently diluting shareholders. Of course, plenty of companies use debt to fund growth, without any negative consequences. When we examine debt levels, we first consider both cash and debt levels, together.
Check out our latest analysis for Grifal
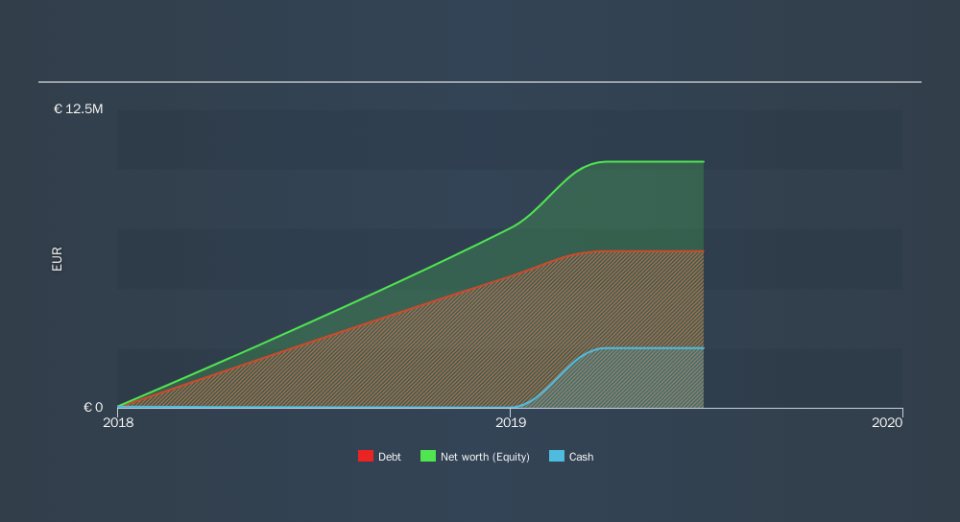
How Much Debt Does Grifal Carry?
The image below, which you can click on for greater detail, shows that at June 2019 Grifal had debt of €6.56m, up from none in one year. On the flip side, it has €2.51m in cash leading to net debt of about €4.06m.
How Strong Is Grifal's Balance Sheet?
We can see from the most recent balance sheet that Grifal had liabilities of €9.23m falling due within a year, and liabilities of €4.27m due beyond that. Offsetting these obligations, it had cash of €2.51m as well as receivables valued at €8.15m due within 12 months. So its liabilities total €2.84m more than the combination of its cash and short-term receivables.
Given Grifal has a market capitalization of €37.0m, it's hard to believe these liabilities pose much threat. Having said that, it's clear that we should continue to monitor its balance sheet, lest it change for the worse.
We use two main ratios to inform us about debt levels relative to earnings. The first is net debt divided by earnings before interest, tax, depreciation, and amortization (EBITDA), while the second is how many times its earnings before interest and tax (EBIT) covers its interest expense (or its interest cover, for short). Thus we consider debt relative to earnings both with and without depreciation and amortization expenses.
Grifal has net debt worth 2.3 times EBITDA, which isn't too much, but its interest cover looks a bit on the low side, with EBIT at only 4.8 times the interest expense. While that doesn't worry us too much, it does suggest the interest payments are somewhat of a burden. Notably, Grifal's EBIT launched higher than Elon Musk, gaining a whopping 189% on last year. The balance sheet is clearly the area to focus on when you are analysing debt. But it is future earnings, more than anything, that will determine Grifal's ability to maintain a healthy balance sheet going forward. So if you want to see what the professionals think, you might find this free report on analyst profit forecasts to be interesting.
Finally, a company can only pay off debt with cold hard cash, not accounting profits. So it's worth checking how much of that EBIT is backed by free cash flow. During the last two years, Grifal burned a lot of cash. While investors are no doubt expecting a reversal of that situation in due course, it clearly does mean its use of debt is more risky.
Our View
Grifal's conversion of EBIT to free cash flow was a real negative on this analysis, although the other factors we considered were considerably better In particular, we are dazzled with its EBIT growth rate. Looking at all this data makes us feel a little cautious about Grifal's debt levels. While we appreciate debt can enhance returns on equity, we'd suggest that shareholders keep close watch on its debt levels, lest they increase. Over time, share prices tend to follow earnings per share, so if you're interested in Grifal, you may well want to click here to check an interactive graph of its earnings per share history.
If you're interested in investing in businesses that can grow profits without the burden of debt, then check out this free list of growing businesses that have net cash on the balance sheet.
We aim to bring you long-term focused research analysis driven by fundamental data. Note that our analysis may not factor in the latest price-sensitive company announcements or qualitative material.
If you spot an error that warrants correction, please contact the editor at editorial-team@simplywallst.com. This article by Simply Wall St is general in nature. It does not constitute a recommendation to buy or sell any stock, and does not take account of your objectives, or your financial situation. Simply Wall St has no position in the stocks mentioned. Thank you for reading.
