Is Heritage Commerce Corp's (NASDAQ:HTBK) High P/E Ratio A Problem For Investors?

The goal of this article is to teach you how to use price to earnings ratios (P/E ratios). We'll look at Heritage Commerce Corp's (NASDAQ:HTBK) P/E ratio and reflect on what it tells us about the company's share price. Based on the last twelve months, Heritage Commerce's P/E ratio is 13.76. In other words, at today's prices, investors are paying $13.76 for every $1 in prior year profit.
Check out our latest analysis for Heritage Commerce
How Do You Calculate A P/E Ratio?
The formula for price to earnings is:
Price to Earnings Ratio = Share Price ÷ Earnings per Share (EPS)
Or for Heritage Commerce:
P/E of 13.76 = USD11.93 ÷ USD0.87 (Based on the year to December 2019.)
Is A High P/E Ratio Good?
A higher P/E ratio means that investors are paying a higher price for each USD1 of company earnings. That is not a good or a bad thing per se, but a high P/E does imply buyers are optimistic about the future.
How Does Heritage Commerce's P/E Ratio Compare To Its Peers?
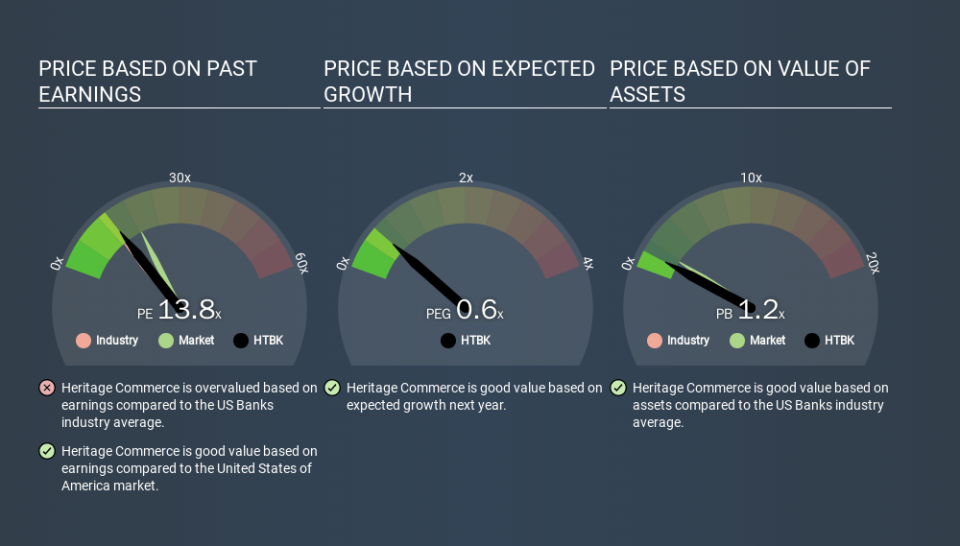
The P/E ratio essentially measures market expectations of a company. The image below shows that Heritage Commerce has a higher P/E than the average (12.6) P/E for companies in the banks industry.
Its relatively high P/E ratio indicates that Heritage Commerce shareholders think it will perform better than other companies in its industry classification. The market is optimistic about the future, but that doesn't guarantee future growth. So investors should always consider the P/E ratio alongside other factors, such as whether company directors have been buying shares.
How Growth Rates Impact P/E Ratios
P/E ratios primarily reflect market expectations around earnings growth rates. When earnings grow, the 'E' increases, over time. That means even if the current P/E is high, it will reduce over time if the share price stays flat. A lower P/E should indicate the stock is cheap relative to others -- and that may attract buyers.
Heritage Commerce had pretty flat EPS growth in the last year. But over the longer term (5 years) earnings per share have increased by 16%.
Don't Forget: The P/E Does Not Account For Debt or Bank Deposits
Don't forget that the P/E ratio considers market capitalization. That means it doesn't take debt or cash into account. The exact same company would hypothetically deserve a higher P/E ratio if it had a strong balance sheet, than if it had a weak one with lots of debt, because a cashed up company can spend on growth.
Spending on growth might be good or bad a few years later, but the point is that the P/E ratio does not account for the option (or lack thereof).
Is Debt Impacting Heritage Commerce's P/E?
Since Heritage Commerce holds net cash of US$17m, it can spend on growth, justifying a higher P/E ratio than otherwise.
The Bottom Line On Heritage Commerce's P/E Ratio
Heritage Commerce trades on a P/E ratio of 13.8, which is below the US market average of 18.6. EPS was up modestly better over the last twelve months. Also positive, the relatively strong balance sheet will allow for investment in growth. In contrast, the P/E indicates shareholders doubt that will happen! Because analysts are predicting more growth in the future, one might have expected to see a higher P/E ratio. You can take a closer look at the fundamentals, here.
When the market is wrong about a stock, it gives savvy investors an opportunity. If the reality for a company is not as bad as the P/E ratio indicates, then the share price should increase as the market realizes this. So this free visualization of the analyst consensus on future earnings could help you make the right decision about whether to buy, sell, or hold.
Of course, you might find a fantastic investment by looking at a few good candidates. So take a peek at this free list of companies with modest (or no) debt, trading on a P/E below 20.
If you spot an error that warrants correction, please contact the editor at editorial-team@simplywallst.com. This article by Simply Wall St is general in nature. It does not constitute a recommendation to buy or sell any stock, and does not take account of your objectives, or your financial situation. Simply Wall St has no position in the stocks mentioned.
We aim to bring you long-term focused research analysis driven by fundamental data. Note that our analysis may not factor in the latest price-sensitive company announcements or qualitative material. Thank you for reading.

