Is Hindustan Oil Exploration Company Limited's (NSE:HINDOILEXP) P/E Ratio Really That Good?

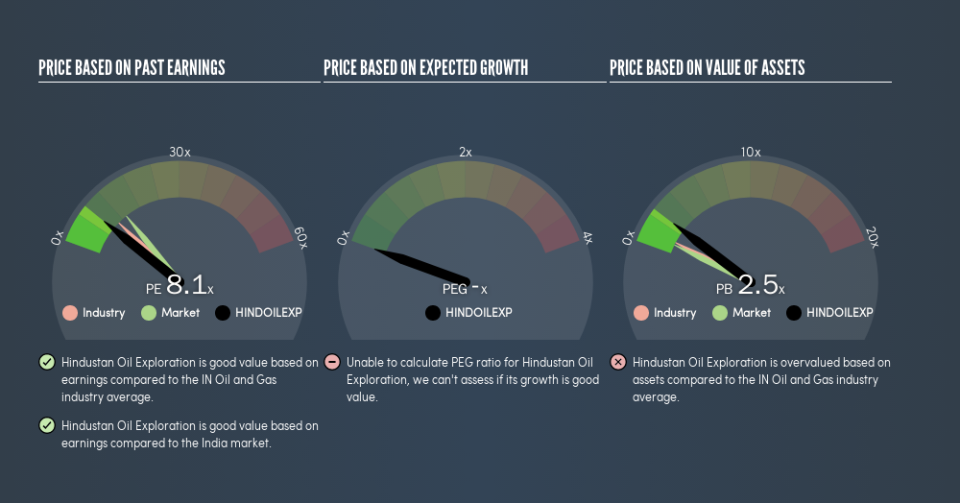
Today, we'll introduce the concept of the P/E ratio for those who are learning about investing. To keep it practical, we'll show how Hindustan Oil Exploration Company Limited's (NSE:HINDOILEXP) P/E ratio could help you assess the value on offer. What is Hindustan Oil Exploration's P/E ratio? Well, based on the last twelve months it is 8.13. That corresponds to an earnings yield of approximately 12%.
Check out our latest analysis for Hindustan Oil Exploration
How Do I Calculate Hindustan Oil Exploration's Price To Earnings Ratio?
The formula for price to earnings is:
Price to Earnings Ratio = Price per Share ÷ Earnings per Share (EPS)
Or for Hindustan Oil Exploration:
P/E of 8.13 = ₹102.1 ÷ ₹12.56 (Based on the year to June 2019.)
Is A High Price-to-Earnings Ratio Good?
A higher P/E ratio implies that investors pay a higher price for the earning power of the business. That isn't necessarily good or bad, but a high P/E implies relatively high expectations of what a company can achieve in the future.
Does Hindustan Oil Exploration Have A Relatively High Or Low P/E For Its Industry?
The P/E ratio indicates whether the market has higher or lower expectations of a company. We can see in the image below that the average P/E (10.5) for companies in the oil and gas industry is higher than Hindustan Oil Exploration's P/E.
This suggests that market participants think Hindustan Oil Exploration will underperform other companies in its industry. Many investors like to buy stocks when the market is pessimistic about their prospects. It is arguably worth checking if insiders are buying shares, because that might imply they believe the stock is undervalued.
How Growth Rates Impact P/E Ratios
Probably the most important factor in determining what P/E a company trades on is the earnings growth. If earnings are growing quickly, then the 'E' in the equation will increase faster than it would otherwise. And in that case, the P/E ratio itself will drop rather quickly. So while a stock may look expensive based on past earnings, it could be cheap based on future earnings.
In the last year, Hindustan Oil Exploration grew EPS like Taylor Swift grew her fan base back in 2010; the 144% gain was both fast and well deserved. And earnings per share have improved by 220% annually, over the last three years. So we'd absolutely expect it to have a relatively high P/E ratio.
Don't Forget: The P/E Does Not Account For Debt or Bank Deposits
It's important to note that the P/E ratio considers the market capitalization, not the enterprise value. In other words, it does not consider any debt or cash that the company may have on the balance sheet. Hypothetically, a company could reduce its future P/E ratio by spending its cash (or taking on debt) to achieve higher earnings.
Such spending might be good or bad, overall, but the key point here is that you need to look at debt to understand the P/E ratio in context.
Is Debt Impacting Hindustan Oil Exploration's P/E?
Since Hindustan Oil Exploration holds net cash of ₹1.4b, it can spend on growth, justifying a higher P/E ratio than otherwise.
The Bottom Line On Hindustan Oil Exploration's P/E Ratio
Hindustan Oil Exploration's P/E is 8.1 which is below average (13.4) in the IN market. It grew its EPS nicely over the last year, and the healthy balance sheet implies there is more potential for growth. One might conclude that the market is a bit pessimistic, given the low P/E ratio.
Investors have an opportunity when market expectations about a stock are wrong. If the reality for a company is not as bad as the P/E ratio indicates, then the share price should increase as the market realizes this. Although we don't have analyst forecasts, you could get a better understanding of its growth by checking out this more detailed historical graph of earnings, revenue and cash flow.
Of course, you might find a fantastic investment by looking at a few good candidates. So take a peek at this free list of companies with modest (or no) debt, trading on a P/E below 20.
We aim to bring you long-term focused research analysis driven by fundamental data. Note that our analysis may not factor in the latest price-sensitive company announcements or qualitative material.
If you spot an error that warrants correction, please contact the editor at editorial-team@simplywallst.com. This article by Simply Wall St is general in nature. It does not constitute a recommendation to buy or sell any stock, and does not take account of your objectives, or your financial situation. Simply Wall St has no position in the stocks mentioned. Thank you for reading.
