Is Hitech Corporation Limited (NSE:HITECHCORP) Struggling With Its 11% Return On Capital Employed?

Today we'll evaluate Hitech Corporation Limited (NSE:HITECHCORP) to determine whether it could have potential as an investment idea. Specifically, we're going to calculate its Return On Capital Employed (ROCE), in the hopes of getting some insight into the business.
First of all, we'll work out how to calculate ROCE. Next, we'll compare it to others in its industry. And finally, we'll look at how its current liabilities are impacting its ROCE.
Return On Capital Employed (ROCE): What is it?
ROCE measures the amount of pre-tax profits a company can generate from the capital employed in its business. All else being equal, a better business will have a higher ROCE. Overall, it is a valuable metric that has its flaws. Author Edwin Whiting says to be careful when comparing the ROCE of different businesses, since 'No two businesses are exactly alike.'
How Do You Calculate Return On Capital Employed?
The formula for calculating the return on capital employed is:
Return on Capital Employed = Earnings Before Interest and Tax (EBIT) ÷ (Total Assets - Current Liabilities)
Or for Hitech:
0.11 = ₹321m ÷ (₹4.0b - ₹1.2b) (Based on the trailing twelve months to June 2019.)
Therefore, Hitech has an ROCE of 11%.
View our latest analysis for Hitech
Is Hitech's ROCE Good?
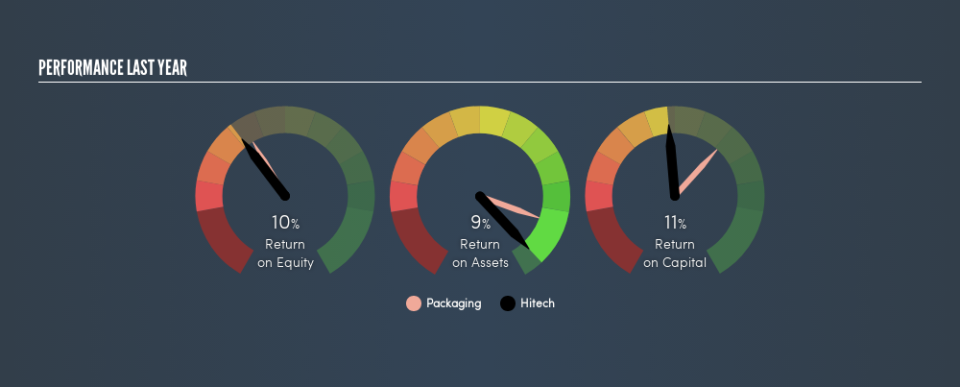
ROCE is commonly used for comparing the performance of similar businesses. We can see Hitech's ROCE is meaningfully below the Packaging industry average of 15%. This performance is not ideal, as it suggests the company may not be deploying its capital as effectively as some competitors. Setting aside the industry comparison for now, Hitech's ROCE is mediocre in absolute terms, considering the risk of investing in stocks versus the safety of a bank account. It is possible that there are more rewarding investments out there.
Hitech's current ROCE of 11% is lower than 3 years ago, when the company reported a 17% ROCE. This makes us wonder if the business is facing new challenges. You can see in the image below how Hitech's ROCE compares to its industry. Click to see more on past growth.
It is important to remember that ROCE shows past performance, and is not necessarily predictive. Companies in cyclical industries can be difficult to understand using ROCE, as returns typically look high during boom times, and low during busts. This is because ROCE only looks at one year, instead of considering returns across a whole cycle. If Hitech is cyclical, it could make sense to check out this free graph of past earnings, revenue and cash flow.
How Hitech's Current Liabilities Impact Its ROCE
Liabilities, such as supplier bills and bank overdrafts, are referred to as current liabilities if they need to be paid within 12 months. The ROCE equation subtracts current liabilities from capital employed, so a company with a lot of current liabilities appears to have less capital employed, and a higher ROCE than otherwise. To counteract this, we check if a company has high current liabilities, relative to its total assets.
Hitech has total assets of ₹4.0b and current liabilities of ₹1.2b. Therefore its current liabilities are equivalent to approximately 30% of its total assets. Hitech has a medium level of current liabilities, which would boost its ROCE somewhat.
Our Take On Hitech's ROCE
Unfortunately, its ROCE is still uninspiring, and there are potentially more attractive prospects out there. Of course, you might also be able to find a better stock than Hitech. So you may wish to see this free collection of other companies that have grown earnings strongly.
I will like Hitech better if I see some big insider buys. While we wait, check out this free list of growing companies with considerable, recent, insider buying.
We aim to bring you long-term focused research analysis driven by fundamental data. Note that our analysis may not factor in the latest price-sensitive company announcements or qualitative material.
If you spot an error that warrants correction, please contact the editor at editorial-team@simplywallst.com. This article by Simply Wall St is general in nature. It does not constitute a recommendation to buy or sell any stock, and does not take account of your objectives, or your financial situation. Simply Wall St has no position in the stocks mentioned. Thank you for reading.
