Is HiTech Group Australia Limited's (ASX:HIT) P/E Ratio Really That Good?

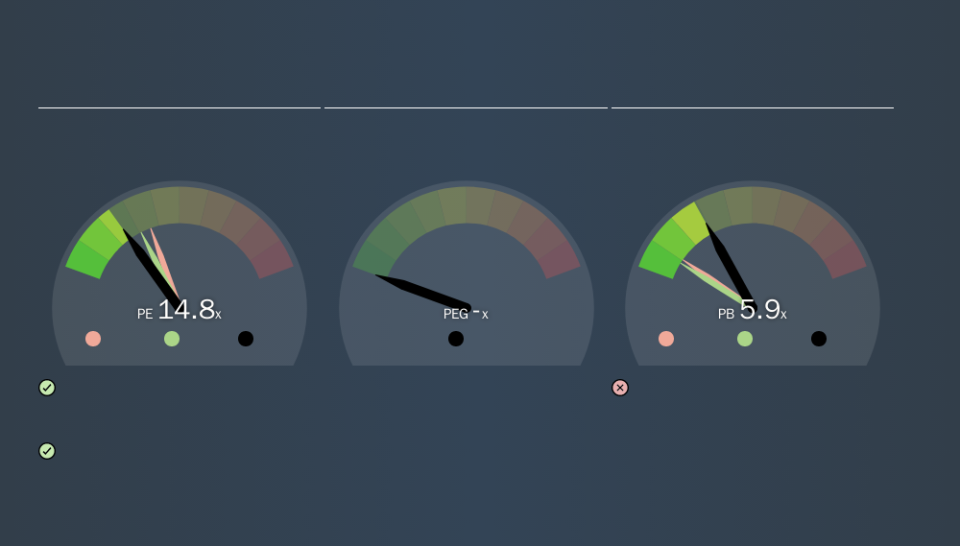
This article is written for those who want to get better at using price to earnings ratios (P/E ratios). To keep it practical, we'll show how HiTech Group Australia Limited's (ASX:HIT) P/E ratio could help you assess the value on offer. HiTech Group Australia has a P/E ratio of 14.77, based on the last twelve months. That means that at current prices, buyers pay A$14.77 for every A$1 in trailing yearly profits.
See our latest analysis for HiTech Group Australia
How Do You Calculate A P/E Ratio?
The formula for price to earnings is:
Price to Earnings Ratio = Price per Share ÷ Earnings per Share (EPS)
Or for HiTech Group Australia:
P/E of 14.77 = A$1.13 ÷ A$0.08 (Based on the year to June 2019.)
Is A High Price-to-Earnings Ratio Good?
The higher the P/E ratio, the higher the price tag of a business, relative to its trailing earnings. That isn't a good or a bad thing on its own, but a high P/E means that buyers have a higher opinion of the business's prospects, relative to stocks with a lower P/E.
Does HiTech Group Australia Have A Relatively High Or Low P/E For Its Industry?
The P/E ratio indicates whether the market has higher or lower expectations of a company. If you look at the image below, you can see HiTech Group Australia has a lower P/E than the average (21.5) in the professional services industry classification.
HiTech Group Australia's P/E tells us that market participants think it will not fare as well as its peers in the same industry. Many investors like to buy stocks when the market is pessimistic about their prospects. If you consider the stock interesting, further research is recommended. For example, I often monitor director buying and selling.
How Growth Rates Impact P/E Ratios
P/E ratios primarily reflect market expectations around earnings growth rates. If earnings are growing quickly, then the 'E' in the equation will increase faster than it would otherwise. That means even if the current P/E is high, it will reduce over time if the share price stays flat. A lower P/E should indicate the stock is cheap relative to others -- and that may attract buyers.
HiTech Group Australia's earnings per share grew by -7.1% in the last twelve months. And it has improved its earnings per share by 2.8% per year over the last three years.
A Limitation: P/E Ratios Ignore Debt and Cash In The Bank
Don't forget that the P/E ratio considers market capitalization. In other words, it does not consider any debt or cash that the company may have on the balance sheet. The exact same company would hypothetically deserve a higher P/E ratio if it had a strong balance sheet, than if it had a weak one with lots of debt, because a cashed up company can spend on growth.
While growth expenditure doesn't always pay off, the point is that it is a good option to have; but one that the P/E ratio ignores.
So What Does HiTech Group Australia's Balance Sheet Tell Us?
With net cash of AU$5.9m, HiTech Group Australia has a very strong balance sheet, which may be important for its business. Having said that, at 14% of its market capitalization the cash hoard would contribute towards a higher P/E ratio.
The Verdict On HiTech Group Australia's P/E Ratio
HiTech Group Australia has a P/E of 14.8. That's below the average in the AU market, which is 18.5. Earnings improved over the last year. Also positive, the relatively strong balance sheet will allow for investment in growth. In contrast, the P/E indicates shareholders doubt that will happen!
Investors have an opportunity when market expectations about a stock are wrong. As value investor Benjamin Graham famously said, 'In the short run, the market is a voting machine but in the long run, it is a weighing machine. Although we don't have analyst forecasts you could get a better understanding of its growth by checking out this more detailed historical graph of earnings, revenue and cash flow.
Of course you might be able to find a better stock than HiTech Group Australia. So you may wish to see this free collection of other companies that have grown earnings strongly.
We aim to bring you long-term focused research analysis driven by fundamental data. Note that our analysis may not factor in the latest price-sensitive company announcements or qualitative material.
If you spot an error that warrants correction, please contact the editor at editorial-team@simplywallst.com. This article by Simply Wall St is general in nature. It does not constitute a recommendation to buy or sell any stock, and does not take account of your objectives, or your financial situation. Simply Wall St has no position in the stocks mentioned. Thank you for reading.
