Homes prices vs. income: Salt Lake City ranks 14th among nation’s ‘least affordable’ metros
The Salt Lake City area is the 14th least affordable metro across the U.S. based on local home prices and income.
That’s according to a new analysis by the real estate site Home Bay, which was acquired by Clever Real Estate, that compared how fast home prices have soared in relation to American incomes.
The analysis concluded the American dream of homeownership is becoming increasingly unattainable as real estate prices have risen “exponentially” faster than the typical U.S. income over the past 20 years, according to data from the Federal Reserve, the National Association of Realtors and the U.S. Census.
The nation’s home prices have spiked 162% since 2000, while income has increased only 78%, according to the analysis.
Related
“To afford the median-priced home of $433,100, Americans need an annual income of roughly $166,600. But the median household earns just $74,580 — only 45% of the recommended amount,” the Home Bay analysis posted this week states.
“The average house-price-to-income ratio has climbed to 5.8 nationwide — more than double the recommended ratio of 2.6,” Home Bay reported. “In other words, buying a home should cost about 2.6 (times) what the average American makes in a year. In reality, it costs 5.8 (times) the median household income — making homeownership an increasingly elusive dream for today’s home buyers.”
Home prices in Utah and the U.S. have dipped slightly this year thanks to diminished buyer demand amid interest rates hovering around 7% and 8%, but they remain stubbornly high thanks to low home inventory.
Related
The Salt Lake City metro area currently has a median home price of $546,900 and a median household income of $91,891 in 2022 — a price-to-income ratio of 6. That’s “significantly higher than the expert-recommended ratio of 2.6,” according to the analysis. However, none of the 50 most populous metros in the U.S. included in the ranking have a home-price-to-income ratio below or equal to 2.6.
The least affordable metro areas are unsurprisingly concentrated in California: San Jose (with a ratio of 12.1); San Francisco (10.4); San Diego (9.5); and Los Angeles (9.0).
In contrast, the most affordable metros are in the East and Midwest: Pittsburgh (3.2); Buffalo, New York (3.5); Cleveland (3.5); St. Louis (3.6); and Detroit (3.7).
Here’s how the 25 least affordable U.S. metros ranked based on how their home prices compare to incomes:
San Jose, California: Ratio of 12.1 with a median home value of $1.8 million and a median household income of $148,900.
San Francisco, California: Ratio of 10.4, home value of $1.3 million, income of $128,151.
San Diego, California: Ratio of 9.5, home value of $942,400, income of $98,928.
Los Angeles, California: Ratio of 9.0, home value of $789,400, income of $87,743.
Miami, Florida: Ratio of 8.6, home value of $605,000, income of $70,769.
Seattle, Washington: Ratio of 7.4, home value of $793,300, income of $106,909.
Boston, Massachusetts: Ratio of 7.0, home value of $734,200, income of $104,299.
New York, New York: Ratio of 6.9, home value of $629,000, income of $91,562.
Riverside, California: Ratio of 6.9, home value of $570,000, income of $82,803.
Denver, Colorado: Ratio of 6.8, home value of $674,500, income of $98,975.
Portland, Oregon: Ratio of 6.7, home value of $599,400, income of $89,312
Las Vegas, Nevada: Ratio of 6.4, home value of $449,600, income of $70,797.
Orlando, Florida: Ratio of 6.1, home value of $435,000, income of $71,857.
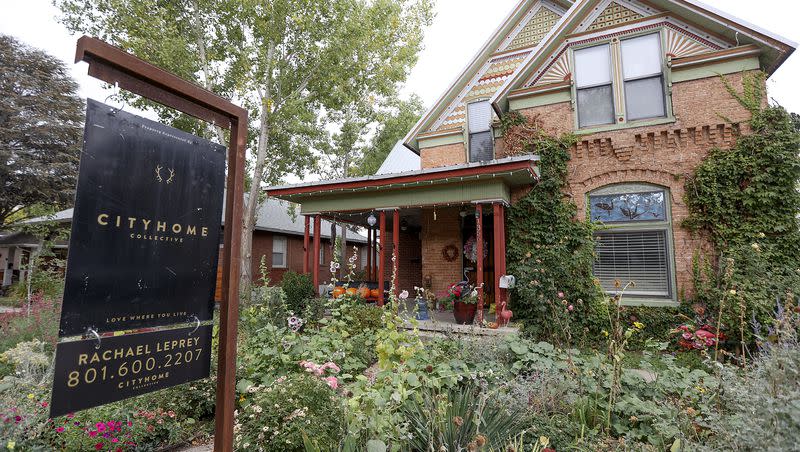
Salt Lake City, Utah: Ratio of 6.0, home value of $546,900, income of $91,891.
Tampa, Florida: Ratio of 5.9, home value of $409,900, income of $69,290.
Sacramento, California: Ratio of 5.9, home value of $530,000, income of $89,237.
Providence, Rhode Island: Ratio of 5.7, home value of $462,300, income of $81,784.
Phoenix, Arizona: Ratio of 5.6, home value of $464,200, income of $82,884.
Milwaukee, Wisconsin: Ratio of 5.5, home value of $387,400, income of $70,898.
Washington, D.C.: Ratio of 5.4, home value of $629,000, income of $117,432.
Austin, Texas: Ratio of 5.3, home value of $496,300, income of $94,604.
Charlotte, North Carolina: Ratio of 5.2, home value of $403,100, income of $77,154.
Raleigh, North Carolina: Ratio of 5.1, home value of $471,600, income of $92,739.
Nashville, Tennessee: Ratio of 5.0, home value of $401,300, income of $80,034.
Jacksonville, Florida: Ratio of 5.0, home value of $390,900, income of $77,583.
Related

