Is Honeywell Automation India Limited's (NSE:HONAUT) High P/E Ratio A Problem For Investors?

Want to participate in a short research study? Help shape the future of investing tools and you could win a $250 gift card!
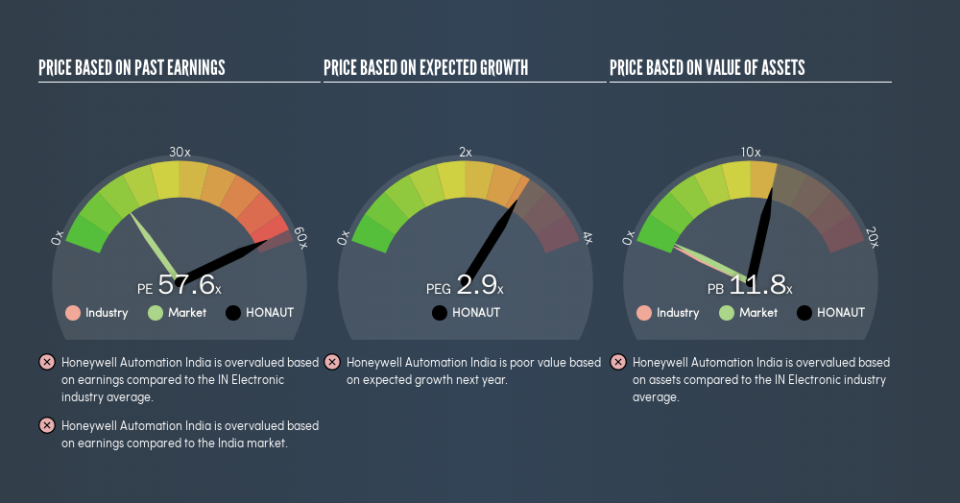
The goal of this article is to teach you how to use price to earnings ratios (P/E ratios). We'll look at Honeywell Automation India Limited's (NSE:HONAUT) P/E ratio and reflect on what it tells us about the company's share price. Honeywell Automation India has a P/E ratio of 57.57, based on the last twelve months. That is equivalent to an earnings yield of about 1.7%.
See our latest analysis for Honeywell Automation India
How Do You Calculate Honeywell Automation India's P/E Ratio?
The formula for P/E is:
Price to Earnings Ratio = Price per Share ÷ Earnings per Share (EPS)
Or for Honeywell Automation India:
P/E of 57.57 = ₹23365.7 ÷ ₹405.86 (Based on the trailing twelve months to March 2019.)
Is A High Price-to-Earnings Ratio Good?
A higher P/E ratio means that buyers have to pay a higher price for each ₹1 the company has earned over the last year. That isn't a good or a bad thing on its own, but a high P/E means that buyers have a higher opinion of the business's prospects, relative to stocks with a lower P/E.
How Does Honeywell Automation India's P/E Ratio Compare To Its Peers?
The P/E ratio essentially measures market expectations of a company. As you can see below, Honeywell Automation India has a much higher P/E than the average company (14.8) in the electronic industry.
That means that the market expects Honeywell Automation India will outperform other companies in its industry. The market is optimistic about the future, but that doesn't guarantee future growth. So investors should delve deeper. I like to check if company insiders have been buying or selling.
How Growth Rates Impact P/E Ratios
Generally speaking the rate of earnings growth has a profound impact on a company's P/E multiple. That's because companies that grow earnings per share quickly will rapidly increase the 'E' in the equation. That means even if the current P/E is high, it will reduce over time if the share price stays flat. So while a stock may look expensive based on past earnings, it could be cheap based on future earnings.
It's nice to see that Honeywell Automation India grew EPS by a stonking 44% in the last year. And it has bolstered its earnings per share by 30% per year over the last five years. With that performance, I would expect it to have an above average P/E ratio.
A Limitation: P/E Ratios Ignore Debt and Cash In The Bank
One drawback of using a P/E ratio is that it considers market capitalization, but not the balance sheet. In other words, it does not consider any debt or cash that the company may have on the balance sheet. Theoretically, a business can improve its earnings (and produce a lower P/E in the future) by investing in growth. That means taking on debt (or spending its cash).
Such expenditure might be good or bad, in the long term, but the point here is that the balance sheet is not reflected by this ratio.
How Does Honeywell Automation India's Debt Impact Its P/E Ratio?
Since Honeywell Automation India holds net cash of ₹12b, it can spend on growth, justifying a higher P/E ratio than otherwise.
The Verdict On Honeywell Automation India's P/E Ratio
With a P/E ratio of 57.6, Honeywell Automation India is expected to grow earnings very strongly in the years to come. The excess cash it carries is the gravy on top its fast EPS growth. So based on this analysis we'd expect Honeywell Automation India to have a high P/E ratio.
Investors should be looking to buy stocks that the market is wrong about. As value investor Benjamin Graham famously said, 'In the short run, the market is a voting machine but in the long run, it is a weighing machine.' So this free report on the analyst consensus forecasts could help you make a master move on this stock.
Of course, you might find a fantastic investment by looking at a few good candidates. So take a peek at this free list of companies with modest (or no) debt, trading on a P/E below 20.
We aim to bring you long-term focused research analysis driven by fundamental data. Note that our analysis may not factor in the latest price-sensitive company announcements or qualitative material.
If you spot an error that warrants correction, please contact the editor at editorial-team@simplywallst.com. This article by Simply Wall St is general in nature. It does not constitute a recommendation to buy or sell any stock, and does not take account of your objectives, or your financial situation. Simply Wall St has no position in the stocks mentioned. Thank you for reading.
