Honeywell International's (NASDAQ:HON) Debt is Stable Ahead of Earnings
This article was originally published on Simply Wall St News
Honeywell International Inc. ( NASDAQ:HON ) does have debt on its balance sheet. But the real question is whether this debt is making the company risky?
With investors focused on the earnings call tomorrow, we need to ask ourselves, what does a beat or miss mean in the long term? In Honeywell's case, an increase in performance will let us analyze the balance sheet more leniently, while a miss will prompt us to ask the sustainability of the company direction.
Currently, the company seems to be declining, but management promises stabilization and we seem to be at a breaking-point between analyst forecasts and reality.
We want to see how worried should investors be with the current debt levels, and does that matter going forward.
The Dual Nature of Debt
Perhaps surprisingly to some investors, a good debt level can drive value for a company. This happens almost entirely because the interest payments on debt are tax-deductible, and the company gets fresh capital to fund its business operations.
Financing via debt is especially available to older companies with reliable revenue streams and large asset bases with which they can guarantee debt payments.
Debt and other liabilities become risky for a business when it cannot easily fulfill those obligations, either with free cash flow or by raising capital at an attractive price. The reason debt can become risky is when it is maintained at high levels by declining companies, or companies that have cyclical and risky business models.
This means that debt can become an expensive fixed cost that can put a ceiling on growth if management has taken on too much of it.
The way risky debt is reflected on shareholders is when we see indebted companies permanently diluting shareholders because lenders force them to raise capital at a distressed price.
The first step when considering a company's debt levels is to consider its cash and debt together.
See our latest analysis for Honeywell International
What Is Honeywell International's Debt?
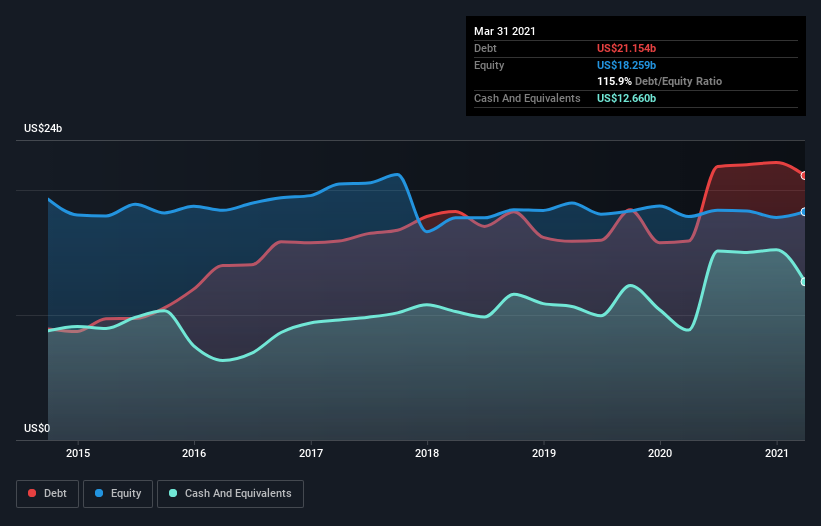
As of March 2021 Honeywell International had US$21.2b of debt, an increase on US$15.9b, over one year. However, it does have US$12.7b in cash offsetting this, leading to net debt of about US$8.49b.
How Healthy Is Honeywell International's Balance Sheet?
According to the last reported balance sheet, Honeywell International had liabilities of US$18.0b due within 12 months, and liabilities of US$27.4b due beyond 12 months.Offsetting these obligations, it had cash of US$12.7b as well as receivables valued at US$6.85b due within 12 months.The liabilities totaled US$25.8b more than the combination of its cash and short-term receivables.
Given Honeywell International has a humongous market capitalization of US$161.0b, it's hard to believe these liabilities pose much threat.However, we do think it is worth keeping an eye on its balance sheet strength, as it may change over time.
We measure a company's debt load relative to its earnings power by looking at its net debt divided by its earnings before interest, tax, depreciation, and amortization (EBITDA) and by calculating how easily its earnings before interest and tax (EBIT) cover its interest expense (interest cover).
This way, we consider both the absolute quantum of the debt, as well as the interest rates paid on it.
Honeywell International's net debt is only 1.1 times its EBITDA. And its EBIT easily covers its interest expense, being 22.3 times the size. So you could argue it is not threatened by its debt.
On the other hand, Honeywell International's EBIT dropped 14%, over the last year. We think that kind of performance, if repeated frequently, could well lead to difficulties for the stock.
When analyzing debt levels, the balance sheet is the obvious place to start. But it is future earnings, more than anything, that will determine Honeywell International's ability to maintain a healthy balance sheet going forward. So if you're focused on the future, you can check out this free report showing analyst profit forecasts.
Finally, a company can only pay off debt with cold hard cash, not accounting profits. So it's worth checking how much of that EBIT is backed by free cash flow. Over the most recent three years, Honeywell International recorded free cash flow worth 77% of its EBIT, which is around normal, given free cash flow excludes interest and tax. This cash means it can reduce its debt when it wants to.
Key Takeaways
The company seems to be slowly declining revenues, but maximizing in value. If management stabilizes Honeywell, the stock will become more stable for investors.
Debt does not seem to be currently a problem, and can perhaps be increased in order to fund good capital projects for Honeywell - this will also reduce some costs via the interest payment reductions in the event that corporate taxes are increased by the government.
The scenario when debt becomes a concern is if the company keeps declining, either because of lack of demand, diminished pricing power in the face of inflation or a tax increase that is not covered by debt interest payments. Also, this can become even worse if the company takes on more long term debt.
For now, we are preparing to see tomorrow's results, as they will give an important reality check on the direction of the company and if more stringent debt management becomes necessary.
When analyzing debt levels, the balance sheet is the obvious place to start. But ultimately, every company can contain risks that exist outside the balance sheet. We've identified 2 warning signs with Honeywell International , and understanding them should be part of your investment process.
Of course, if you're the type of investor who prefers buying stocks without the burden of debt, then don't hesitate to discover our exclusive list of net cash growth stocks, today.
Simply Wall St analyst Goran Damchevski and Simply Wall St have no position in any of the companies mentioned. This article is general in nature. It does not constitute a recommendation to buy or sell any stock and does not take account of your objectives, or your financial situation. We aim to bring you long-term focused analysis driven by fundamental data. Note that our analysis may not factor in the latest price-sensitive company announcements or qualitative material.
Have feedback on this article? Concerned about the content? Get in touch with us directly. Alternatively, email editorial-team@simplywallst.com
