Is Hostelworld Group plc's (LON:HSW) P/E Ratio Really That Good?

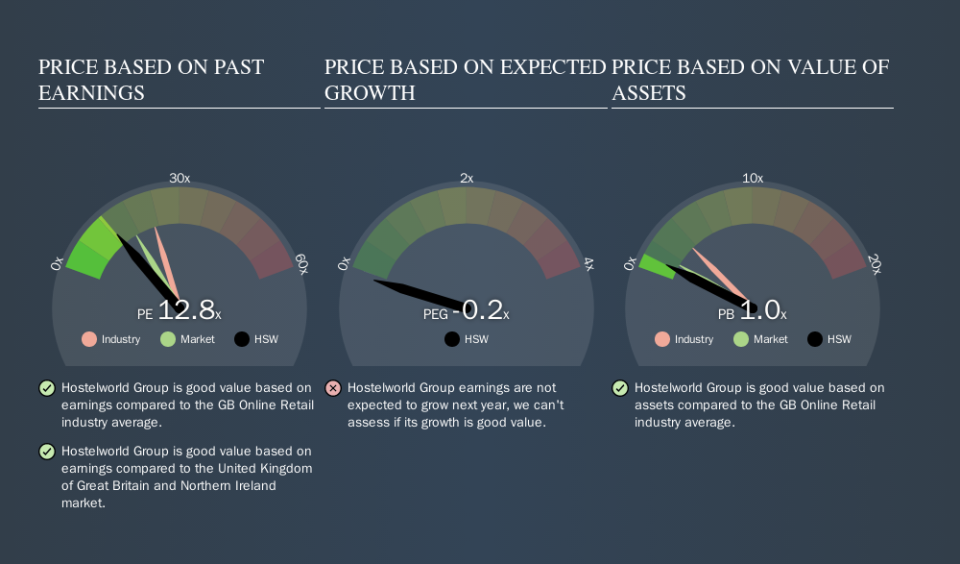
Today, we'll introduce the concept of the P/E ratio for those who are learning about investing. We'll look at Hostelworld Group plc's (LON:HSW) P/E ratio and reflect on what it tells us about the company's share price. Hostelworld Group has a price to earnings ratio of 12.78, based on the last twelve months. In other words, at today's prices, investors are paying £12.78 for every £1 in prior year profit.
Check out our latest analysis for Hostelworld Group
How Do You Calculate A P/E Ratio?
The formula for P/E is:
Price to Earnings Ratio = Price per Share (in the reporting currency) ÷ Earnings per Share (EPS)
Or for Hostelworld Group:
P/E of 12.78 = £1.36 (Note: this is the share price in the reporting currency, namely, EUR ) ÷ £0.11 (Based on the trailing twelve months to June 2019.)
Is A High Price-to-Earnings Ratio Good?
The higher the P/E ratio, the higher the price tag of a business, relative to its trailing earnings. All else being equal, it's better to pay a low price -- but as Warren Buffett said, 'It's far better to buy a wonderful company at a fair price than a fair company at a wonderful price.
How Does Hostelworld Group's P/E Ratio Compare To Its Peers?
We can get an indication of market expectations by looking at the P/E ratio. We can see in the image below that the average P/E (22.7) for companies in the online retail industry is higher than Hostelworld Group's P/E.
Hostelworld Group's P/E tells us that market participants think it will not fare as well as its peers in the same industry. While current expectations are low, the stock could be undervalued if the situation is better than the market assumes. You should delve deeper. I like to check if company insiders have been buying or selling.
How Growth Rates Impact P/E Ratios
When earnings fall, the 'E' decreases, over time. That means unless the share price falls, the P/E will increase in a few years. A higher P/E should indicate the stock is expensive relative to others -- and that may encourage shareholders to sell.
Hostelworld Group increased earnings per share by an impressive 14% over the last twelve months. In contrast, EPS has decreased by 58%, annually, over 3 years.
Remember: P/E Ratios Don't Consider The Balance Sheet
The 'Price' in P/E reflects the market capitalization of the company. In other words, it does not consider any debt or cash that the company may have on the balance sheet. In theory, a company can lower its future P/E ratio by using cash or debt to invest in growth.
Such expenditure might be good or bad, in the long term, but the point here is that the balance sheet is not reflected by this ratio.
How Does Hostelworld Group's Debt Impact Its P/E Ratio?
Hostelworld Group has net cash of €25m. This is fairly high at 20% of its market capitalization. That might mean balance sheet strength is important to the business, but should also help push the P/E a bit higher than it would otherwise be.
The Verdict On Hostelworld Group's P/E Ratio
Hostelworld Group has a P/E of 12.8. That's below the average in the GB market, which is 17.0. Not only should the net cash position reduce risk, but the recent growth has been impressive. One might conclude that the market is a bit pessimistic, given the low P/E ratio.
When the market is wrong about a stock, it gives savvy investors an opportunity. If the reality for a company is not as bad as the P/E ratio indicates, then the share price should increase as the market realizes this. So this free visualization of the analyst consensus on future earnings could help you make the right decision about whether to buy, sell, or hold.
Of course you might be able to find a better stock than Hostelworld Group. So you may wish to see this free collection of other companies that have grown earnings strongly.
We aim to bring you long-term focused research analysis driven by fundamental data. Note that our analysis may not factor in the latest price-sensitive company announcements or qualitative material.
If you spot an error that warrants correction, please contact the editor at editorial-team@simplywallst.com. This article by Simply Wall St is general in nature. It does not constitute a recommendation to buy or sell any stock, and does not take account of your objectives, or your financial situation. Simply Wall St has no position in the stocks mentioned. Thank you for reading.
