Houses in These 29 Cities Are Suddenly Major Bargains

Homeownership certainly isn't a cheap decision. In a shocking 71% of the country, the average family cannot afford a home, according to CBS News. Many first-time and prospective homebuyers are rethinking their big-city dreams -- and for good reason, as millennials find themselves unable to cover the ever-rising housing costs that come with living in a metropolitan area.
Support: The Economy and Your Money: All You Need To Know
Learn: 20 Insider Tips To Save Money on Every Part of Your Home
The median list price for homes currently on the market in New York City is $769,000, which still falls short of the astronomical median list price of San Francisco homes, at $1,348,000. Meanwhile, the U.S. median list price was $286,381 in 2019, though it saw a 4.12% increase from 2018. If you're looking for a bargain on your home, you may find greater success in certain areas of the country.
Find Out: 50 Cities Where It’s Cheaper To Buy a Home Than Rent
To determine which cities currently have the best bargain homes, GOBankingRates analyzed the 2018 and 2019 median list prices for the 200 largest housing markets in the country. The study found 29 cities where the year-over-year change in home prices has declined and also included the average number of days on the market, total monthly listings and percentage of listings with price cuts as supplemental data. GOBankingRates ranked the cities by their year-over-year change in median list prices, with the No. 1 city offering the biggest bargain on real estate.
The South is well represented in this study, in addition to parts of the Pacific Northwest and some California cities, surprisingly. These places offer the best deal if you're looking to buy a house.
Last updated: June 11, 2021
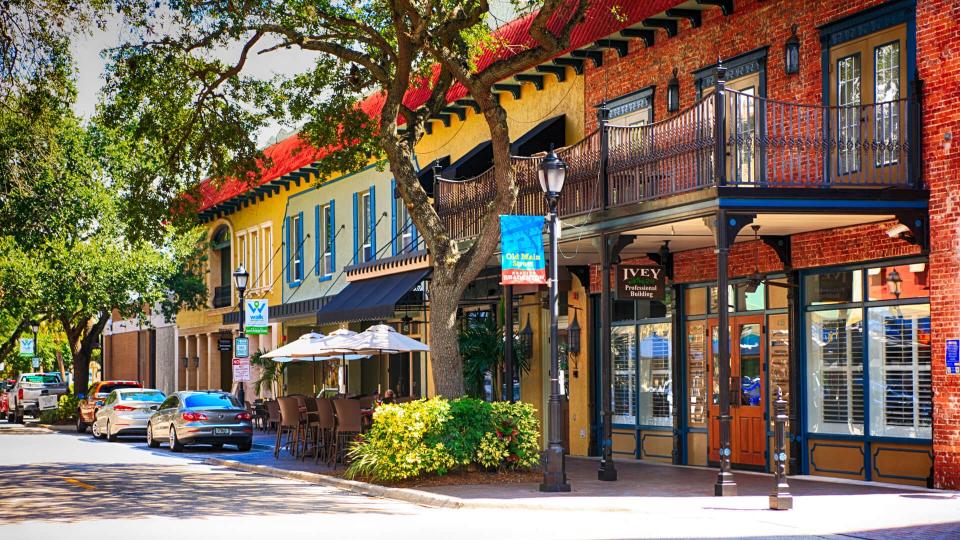
29. Bradenton, Florida
Median list price in 2018: $289,786
Median list price in 2019: $289,218
Year-over-year price change: -0.20%
Average number of days on market: 88
Average total monthly listings: 1,641
Percentage of listings with price cuts: 19.20%
Read More: Home Improvements That Are Not Legal To Do Yourself
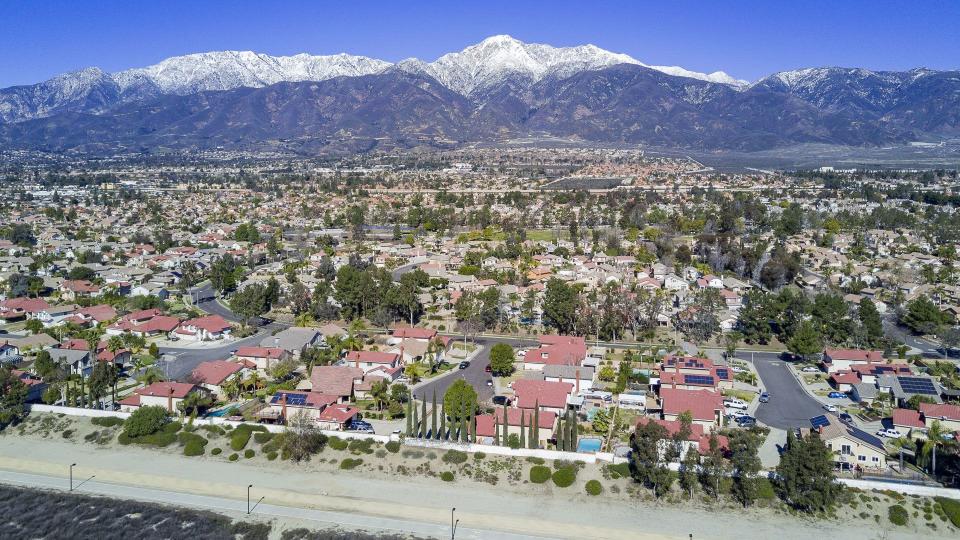
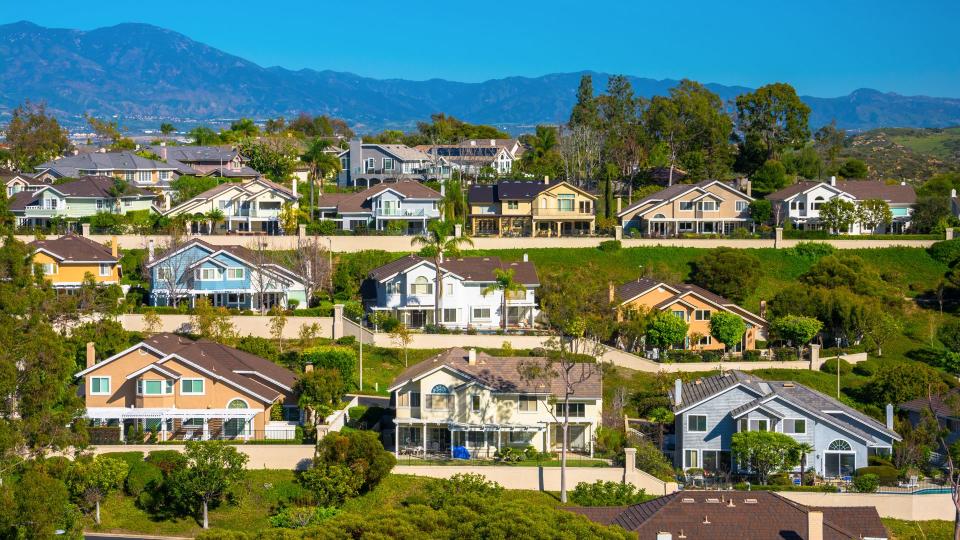
28. Rancho Cucamonga, California
Median list price in 2018: $561,854
Median list price in 2019: $559,423
Year-over-year price change: -0.43%
Average number of days on market: 69
Average total monthly listings: 492
Percentage of listings with price cuts: 16.61%
Learn: Why Paying for a Storage Unit Is Always a Terrible Idea

27. Chesapeake, Virginia
Median list price in 2018: $327,759
Median list price in 2019: $325,666
Year-over-year price change: -0.64%
Average number of days on market: 78
Average total monthly listings: 1,517
Percentage of listings with price cuts: 13.91%
See: 28 House-Flipping Rules You Should Never Break

26. Charleston, South Carolina
Median list price in 2018: $380,706
Median list price in 2019: $378,245
Year-over-year price change: -0.65%
Average number of days on market: 99
Average total monthly listings: 1,795
Percentage of listings with price cuts: 20.30%
Don't Miss: Homes in These 25 Waterfront Cities Are a Total Steal
25. Dallas
Median list price in 2018: $389,596
Median list price in 2019: $386,835
Year-over-year price change: -0.71%
Average number of days on market: 72
Average total monthly listings: 5,116
Percentage of listings with price cuts: 20.76%

24. Shreveport, Louisiana
Median list price in 2018: $166,429
Median list price in 2019: $165,224
Year-over-year price change: -0.72%
Average number of days on market: 100
Average total monthly listings: 1,320
Percentage of listings with price cuts: 17.43%

23. Honolulu
Median list price in 2018: $641,375
Median list price in 2019: $636,703
Year-over-year price change: -0.73%
Average number of days on market: 93
Average total monthly listings: 2,703
Percentage of listings with price cuts: 13.56%

22. Houston
Median list price in 2018: $294,424
Median list price in 2019: $292,226
Year-over-year price change: -0.75%
Average number of days on market: 80
Average total monthly listings: 12,901
Percentage of listings with price cuts: 18.10%
21. Portland, Oregon
Median list price in 2018: $463,275
Median list price in 2019: $459,621
Year-over-year price change: -0.79%
Average number of days on market: 66
Average total monthly listings: 2,933
Percentage of listings with price cuts: 18.86%
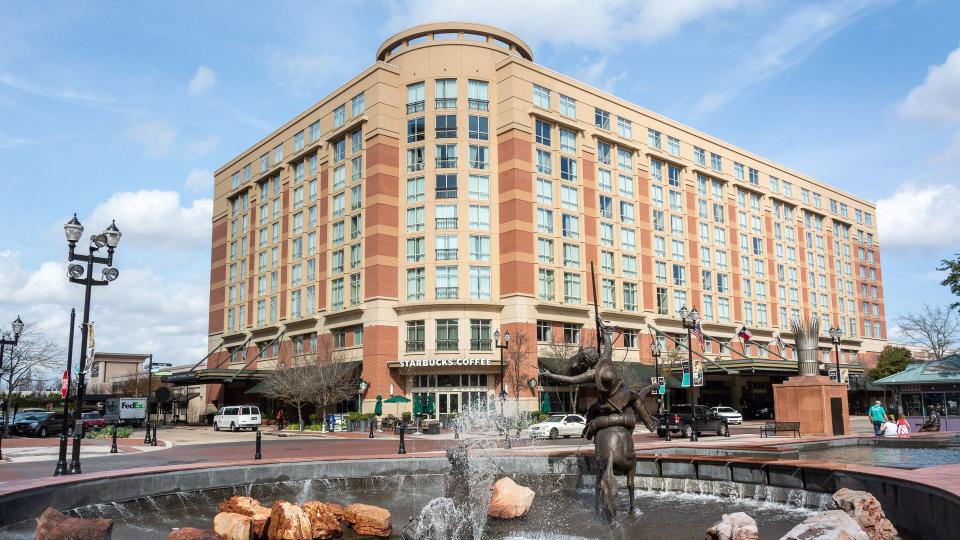
20. Sugar Land, Texas
Median list price in 2018: $412,133
Median list price in 2019: $408,155
Year-over-year price change: -0.97%
Average number of days on market: 90
Average total monthly listings: 981
Percentage of listings with price cuts: 22.16%
See: 17 Dumb Home-Buying Mistakes That Hurt Your Wallet

19. New Orleans
Median list price in 2018: $298,680
Median list price in 2019: $295,642
Year-over-year price change: -1.02%
Average number of days on market: 95
Average total monthly listings: 1,855
Percentage of listings with price cuts: 15.24%

18. Lubbock, Texas
Median list price in 2018: $195,788
Median list price in 2019: $193,757
Year-over-year price change: -1.04%
Average number of days on market: 73
Average total monthly listings: 1,173
Percentage of listings with price cuts: 16.71%

17. Omaha, Nebraska
Median list price in 2018: $250,783
Median list price in 2019: $248,138
Year-over-year price change: -1.05%
Average number of days on market: 58
Average total monthly listings: 1,605
Percentage of listings with price cuts: 17.21%

16. New York
Median list price in 2018: $793,667
Median list price in 2019: $785,083
Year-over-year price change: -1.08%
Average number of days on market: 169
Average total monthly listings: 22,015
Percentage of listings with price cuts: 10.85%

15. Naples, Florida
Median list price in 2018: $406,143
Median list price in 2019: $401,483
Year-over-year price change: -1.15%
Average number of days on market: 137
Average total monthly listings: 6,575
Percentage of listings with price cuts: 15.02%
Learn: How Much It Costs To Live in 15 COVID-Free Countries
14. San Jose, California
Median list price in 2018: $970,398
Median list price in 2019: $957,366
Year-over-year price change: -1.34%
Average number of days on market: 51
Average total monthly listings: 1,278
Percentage of listings with price cuts: 15.22%
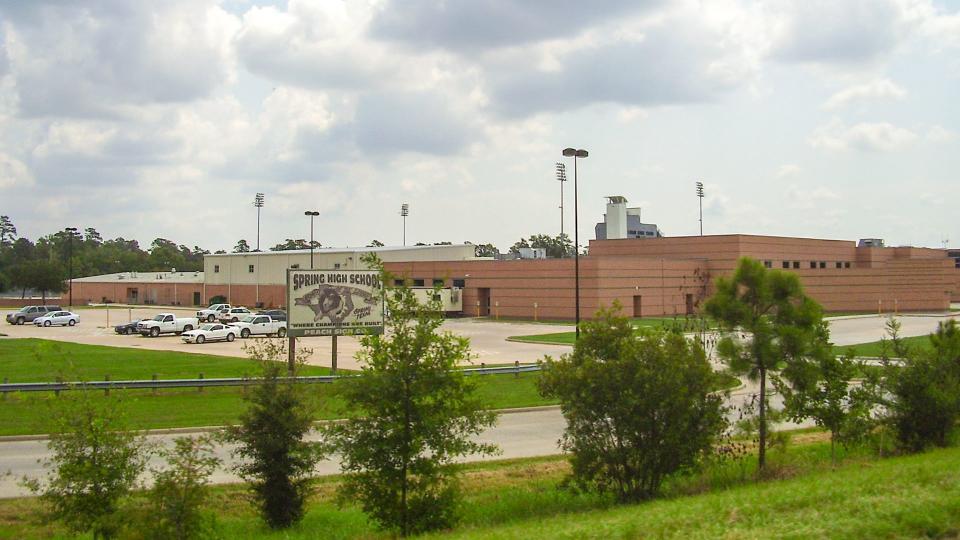
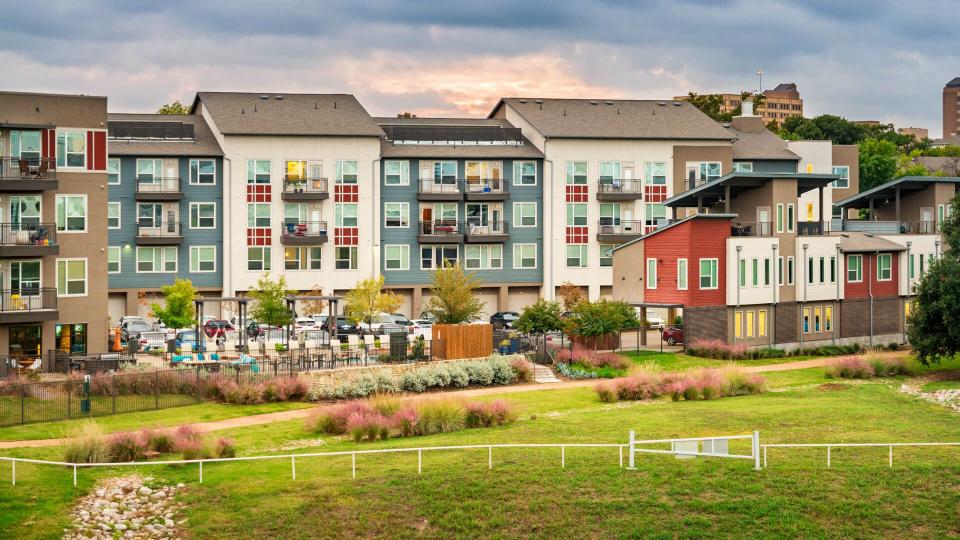
13. Spring, Texas
Median list price in 2018: $271,940
Median list price in 2019: $267,485
Year-over-year price change: -1.64%
Average number of days on market: 79
Average total monthly listings: 1,486
Percentage of listings with price cuts: 20.34%
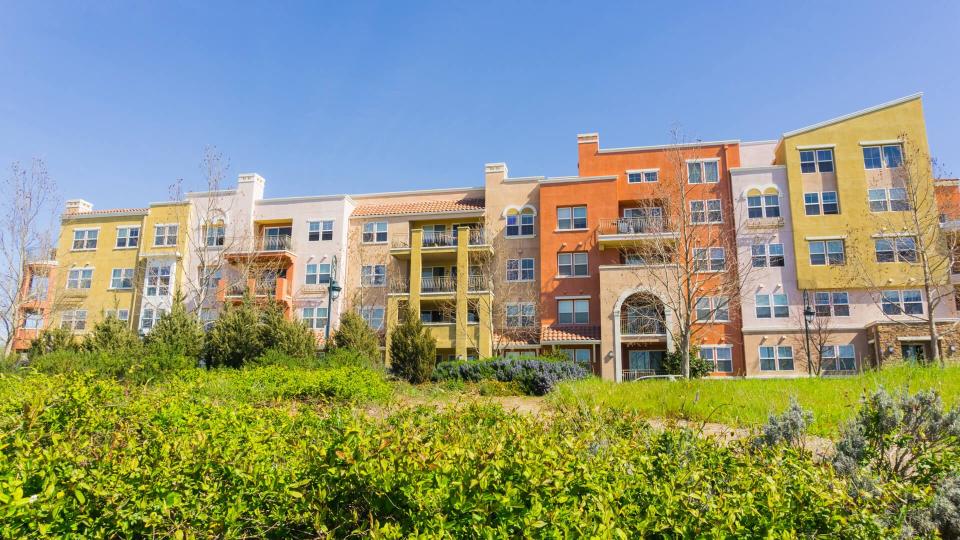
12. Irvine, California
Median list price in 2018: $1,006,474
Median list price in 2019: $987,852
Year-over-year price change: -1.85%
Average number of days on market: 78
Average total monthly listings: 1,021
Percentage of listings with price cuts: 17.34%

11. Atlanta
Median list price in 2018: $333,662
Median list price in 2019: $326,921
Year-over-year price change: -2.02%
Average number of days on market: 76
Average total monthly listings: 4,115
Percentage of listings with price cuts: 17.41%
Good To Know: 50 Neighborhoods Where Home Prices Are Going Through the Roof
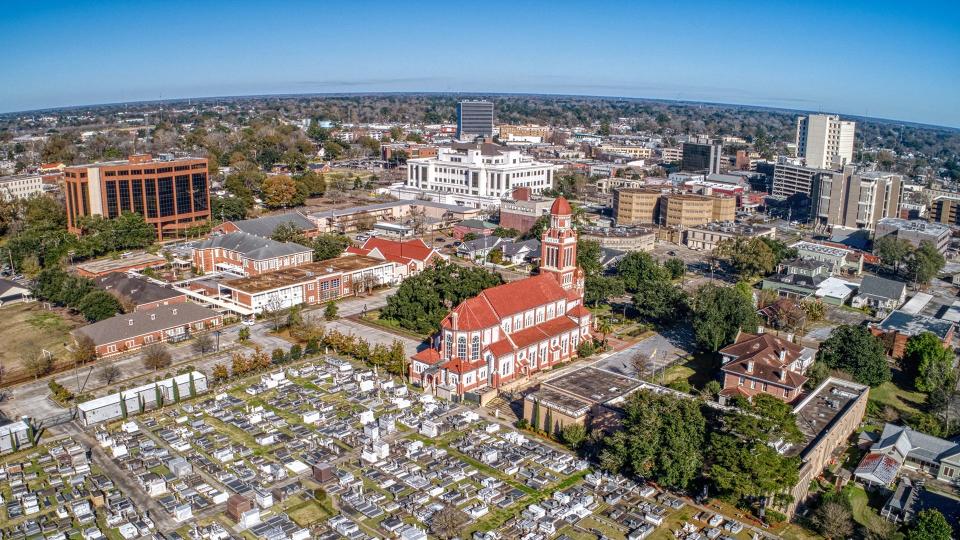
10. Lafayette, Louisiana
Median list price in 2018: $218,546
Median list price in 2019: $213,804
Year-over-year price change: -2.17%
Average number of days on market: N/A
Average total monthly listings: 1,189
Percentage of listings with price cuts: 16.67%

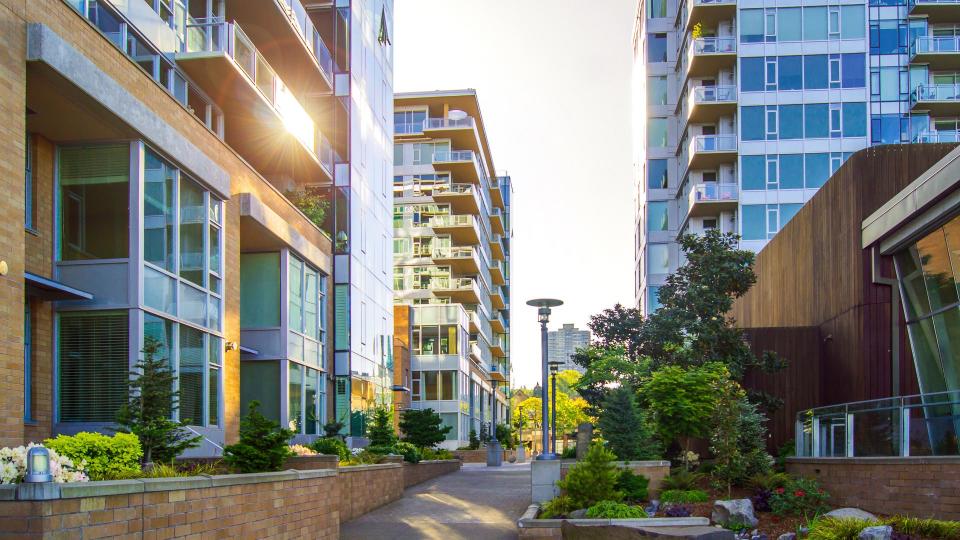
9. Seattle
Median list price in 2018: $713,102
Median list price in 2019: $696,342
Year-over-year price change: -2.35%
Average number of days on market: 55
Average total monthly listings: 2,201
Percentage of listings with price cuts: 15.73%
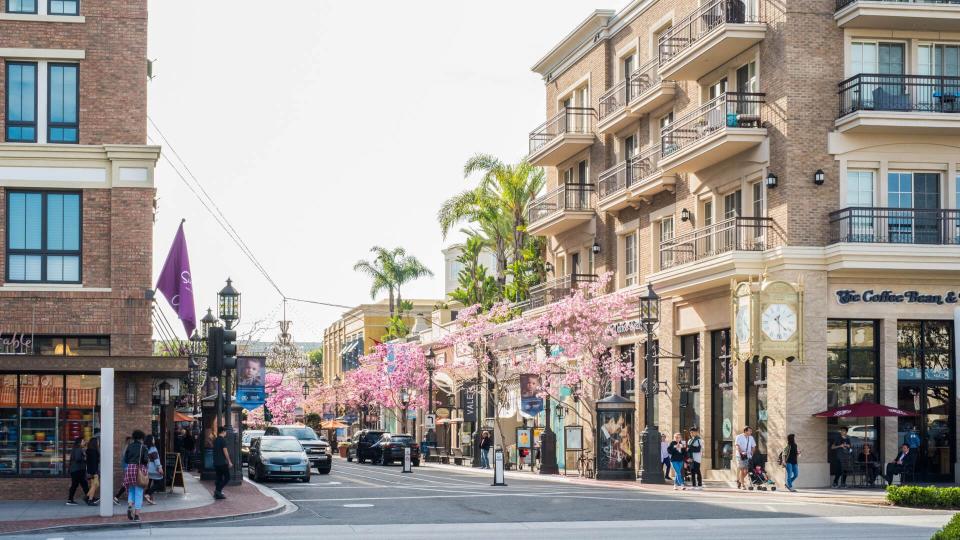
8. Glendale, California
Median list price in 2018: $870,797
Median list price in 2019: $848,645
Year-over-year price change: -2.54%
Average number of days on market: 63
Average total monthly listings: 261
Percentage of listings with price cuts: 12.34%

7. Fremont, California
Median list price in 2018: $1,030,807
Median list price in 2019: $1,003,865
Year-over-year price change: -2.61%
Average number of days on market: 50
Average total monthly listings: 369
Percentage of listings with price cuts: 14.27%
Related: The Best Place To Buy a Home in Every State
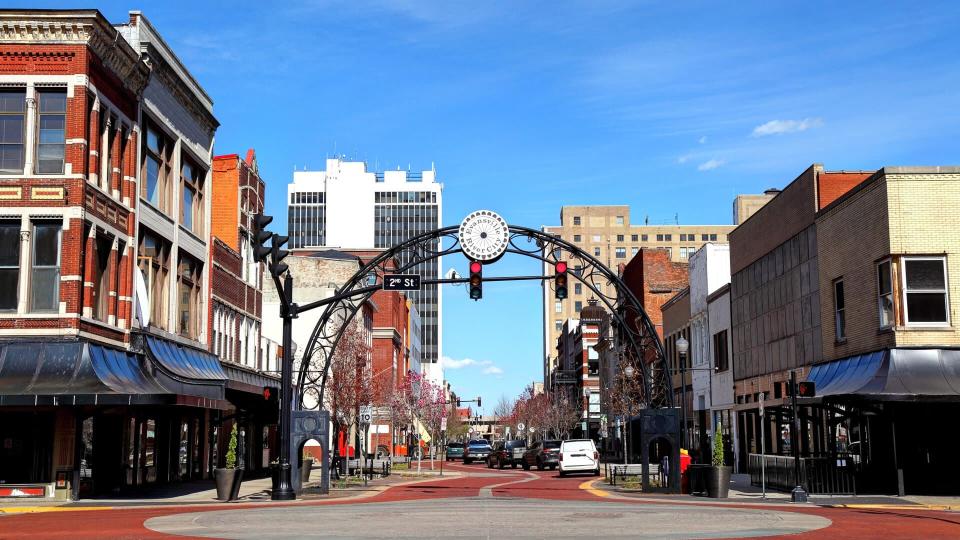
6. Evansville, Indiana
Median list price in 2018: $146,725
Median list price in 2019: $142,325
Year-over-year price change: -3.00%
Average number of days on market: 68
Average total monthly listings: N/A
Percentage of listings with price cuts: 18.07%
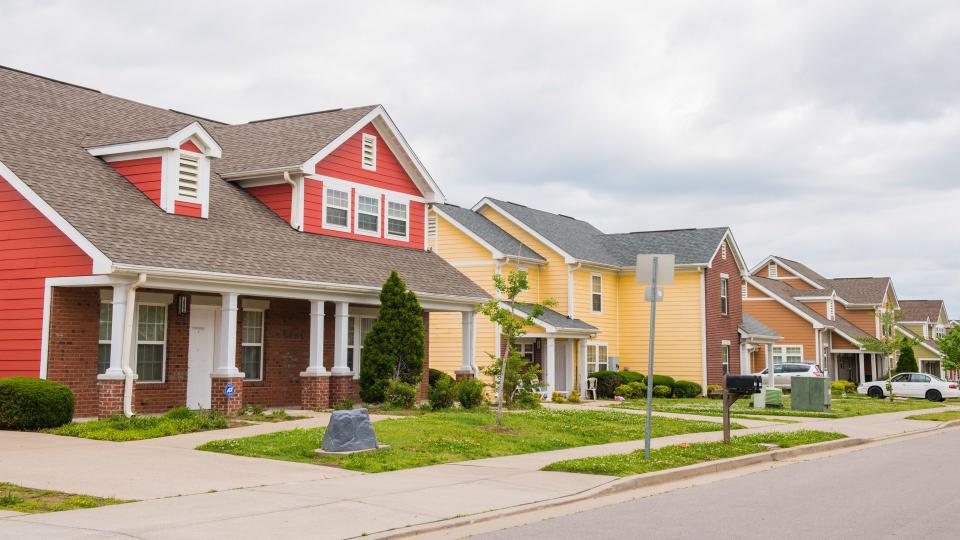
5. Nashville, Tennessee
Median list price in 2018: $334,025
Median list price in 2019: $323,792
Year-over-year price change: -3.06%
Average number of days on market: 68
Average total monthly listings: 3,770
Percentage of listings with price cuts: 14.12%

4. Columbus, Georgia
Median list price in 2018: $117,946
Median list price in 2019: $114,129
Year-over-year price change: -3.24%
Average number of days on market: 76
Average total monthly listings: 774
Percentage of listings with price cuts: 14.70%

3. Irving, Texas
Median list price in 2018: $379,914
Median list price in 2019: $366,135
Year-over-year price change: -3.63%
Average number of days on market: 61
Average total monthly listings: 535
Percentage of listings with price cuts: 17.71%

2. Raleigh, North Carolina
Median list price in 2018: $354,881
Median list price in 2019: $341,615
Year-over-year price change: -3.74%
Average number of days on market: 54
Average total monthly listings: 1,707
Percentage of listings with price cuts: 14.62%
1. Jackson, Mississippi
Median list price in 2018: $134,354
Median list price in 2019: $125,041
Year-over-year price change: -6.93%
Average number of days on market: 97
Average total monthly listings: 590
Percentage of listings with price cuts: 15.56%
More From GOBankingRates
Methodology: In order to find cities where houses are suddenly a major bargain, GOBankingRates looked at the 2018 median list price and the 2019 median list price for the 200 biggest housing markets in the United States and found the year-over-year percentage change in the median list price. GOBankingRates found 29 cities where the median list price has gone down since 2018, and those 29 cities are included on this list. The study also provides the 2019 averages for days on the market, total monthly listings and percentage of listings with price cuts as supplemental data. All data was sourced from Zillow and compiled on Jan. 29, 2020.
This article originally appeared on GOBankingRates.com: Houses in These 29 Cities Are Suddenly Major Bargains
