How Do HSIL Limited’s (NSE:HSIL) Returns Compare To Its Industry?

Today we'll look at HSIL Limited (NSE:HSIL) and reflect on its potential as an investment. Specifically, we're going to calculate its Return On Capital Employed (ROCE), in the hopes of getting some insight into the business.
Firstly, we'll go over how we calculate ROCE. Second, we'll look at its ROCE compared to similar companies. Then we'll determine how its current liabilities are affecting its ROCE.
Return On Capital Employed (ROCE): What is it?
ROCE is a measure of a company's yearly pre-tax profit (its return), relative to the capital employed in the business. In general, businesses with a higher ROCE are usually better quality. In brief, it is a useful tool, but it is not without drawbacks. Author Edwin Whiting says to be careful when comparing the ROCE of different businesses, since 'No two businesses are exactly alike.'
How Do You Calculate Return On Capital Employed?
Analysts use this formula to calculate return on capital employed:
Return on Capital Employed = Earnings Before Interest and Tax (EBIT) ÷ (Total Assets - Current Liabilities)
Or for HSIL:
0.077 = ₹1.9b ÷ (₹36b - ₹10b) (Based on the trailing twelve months to March 2019.)
Therefore, HSIL has an ROCE of 7.7%.
See our latest analysis for HSIL
Is HSIL's ROCE Good?
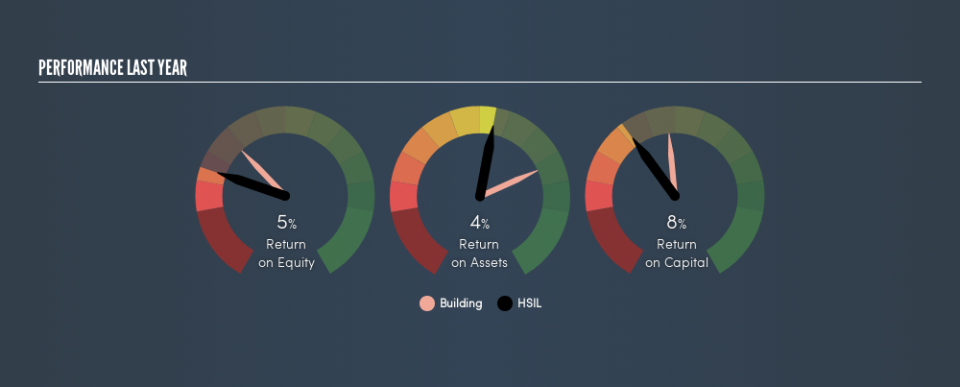
When making comparisons between similar businesses, investors may find ROCE useful. We can see HSIL's ROCE is meaningfully below the Building industry average of 12%. This performance is not ideal, as it suggests the company may not be deploying its capital as effectively as some competitors. Putting aside HSIL's performance relative to its industry, its ROCE in absolute terms is poor - considering the risk of owning stocks compared to government bonds. Readers may wish to look for more rewarding investments.
HSIL's current ROCE of 7.7% is lower than 3 years ago, when the company reported a 11% ROCE. Therefore we wonder if the company is facing new headwinds. You can click on the image below to see (in greater detail) how HSIL's past growth compares to other companies.
When considering this metric, keep in mind that it is backwards looking, and not necessarily predictive. Companies in cyclical industries can be difficult to understand using ROCE, as returns typically look high during boom times, and low during busts. ROCE is, after all, simply a snap shot of a single year. Future performance is what matters, and you can see analyst predictions in our free report on analyst forecasts for the company.
HSIL's Current Liabilities And Their Impact On Its ROCE
Current liabilities are short term bills and invoices that need to be paid in 12 months or less. Due to the way the ROCE equation works, having large bills due in the near term can make it look as though a company has less capital employed, and thus a higher ROCE than usual. To check the impact of this, we calculate if a company has high current liabilities relative to its total assets.
HSIL has total liabilities of ₹10b and total assets of ₹36b. As a result, its current liabilities are equal to approximately 29% of its total assets. This is not a high level of current liabilities, which would not boost the ROCE by much.
The Bottom Line On HSIL's ROCE
That's not a bad thing, however HSIL has a weak ROCE and may not be an attractive investment. Of course, you might find a fantastic investment by looking at a few good candidates. So take a peek at this free list of companies with modest (or no) debt, trading on a P/E below 20.
For those who like to find winning investments this free list of growing companies with recent insider purchasing, could be just the ticket.
We aim to bring you long-term focused research analysis driven by fundamental data. Note that our analysis may not factor in the latest price-sensitive company announcements or qualitative material.
If you spot an error that warrants correction, please contact the editor at editorial-team@simplywallst.com. This article by Simply Wall St is general in nature. It does not constitute a recommendation to buy or sell any stock, and does not take account of your objectives, or your financial situation. Simply Wall St has no position in the stocks mentioned. Thank you for reading.
