Is Hudson Ltd. (NYSE:HUD) Struggling With Its 6.5% Return On Capital Employed?

Want to participate in a short research study? Help shape the future of investing tools and you could win a $250 gift card!
Today we'll look at Hudson Ltd. (NYSE:HUD) and reflect on its potential as an investment. To be precise, we'll consider its Return On Capital Employed (ROCE), as that will inform our view of the quality of the business.
First up, we'll look at what ROCE is and how we calculate it. Next, we'll compare it to others in its industry. Finally, we'll look at how its current liabilities affect its ROCE.
Return On Capital Employed (ROCE): What is it?
ROCE measures the amount of pre-tax profits a company can generate from the capital employed in its business. Generally speaking a higher ROCE is better. Overall, it is a valuable metric that has its flaws. Renowned investment researcher Michael Mauboussin has suggested that a high ROCE can indicate that 'one dollar invested in the company generates value of more than one dollar'.
How Do You Calculate Return On Capital Employed?
Analysts use this formula to calculate return on capital employed:
Return on Capital Employed = Earnings Before Interest and Tax (EBIT) ÷ (Total Assets - Current Liabilities)
Or for Hudson:
0.065 = US$133m ÷ (US$2.5b - US$458m) (Based on the trailing twelve months to March 2019.)
Therefore, Hudson has an ROCE of 6.5%.
View our latest analysis for Hudson
Does Hudson Have A Good ROCE?
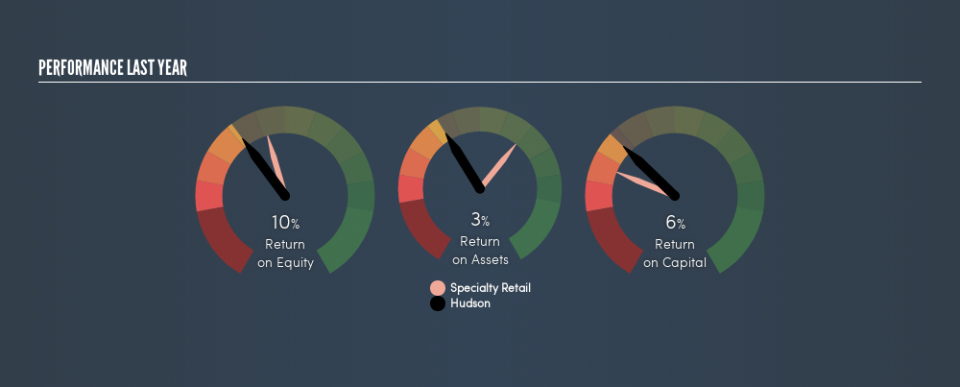
When making comparisons between similar businesses, investors may find ROCE useful. In this analysis, Hudson's ROCE appears meaningfully below the 11% average reported by the Specialty Retail industry. This performance is not ideal, as it suggests the company may not be deploying its capital as effectively as some competitors. Setting aside the industry comparison for now, Hudson's ROCE is mediocre in absolute terms, considering the risk of investing in stocks versus the safety of a bank account. It is possible that there are more rewarding investments out there.
Our data shows that Hudson currently has an ROCE of 6.5%, compared to its ROCE of 3.9% 3 years ago. This makes us think the business might be improving. The image below shows how Hudson's ROCE compares to its industry, and you can click it to see more detail on its past growth.
When considering this metric, keep in mind that it is backwards looking, and not necessarily predictive. ROCE can be deceptive for cyclical businesses, as returns can look incredible in boom times, and terribly low in downturns. ROCE is only a point-in-time measure. Since the future is so important for investors, you should check out our free report on analyst forecasts for Hudson.
What Are Current Liabilities, And How Do They Affect Hudson's ROCE?
Liabilities, such as supplier bills and bank overdrafts, are referred to as current liabilities if they need to be paid within 12 months. Due to the way the ROCE equation works, having large bills due in the near term can make it look as though a company has less capital employed, and thus a higher ROCE than usual. To counter this, investors can check if a company has high current liabilities relative to total assets.
Hudson has total liabilities of US$458m and total assets of US$2.5b. Therefore its current liabilities are equivalent to approximately 18% of its total assets. This very reasonable level of current liabilities would not boost the ROCE by much.
What We Can Learn From Hudson's ROCE
With that in mind, we're not overly impressed with Hudson's ROCE, so it may not be the most appealing prospect. Of course, you might find a fantastic investment by looking at a few good candidates. So take a peek at this free list of companies with modest (or no) debt, trading on a P/E below 20.
For those who like to find winning investments this free list of growing companies with recent insider purchasing, could be just the ticket.
We aim to bring you long-term focused research analysis driven by fundamental data. Note that our analysis may not factor in the latest price-sensitive company announcements or qualitative material.
If you spot an error that warrants correction, please contact the editor at editorial-team@simplywallst.com. This article by Simply Wall St is general in nature. It does not constitute a recommendation to buy or sell any stock, and does not take account of your objectives, or your financial situation. Simply Wall St has no position in the stocks mentioned. Thank you for reading.

