Hutter & Schrantz Stahlbau AG (VIE:HST) Earns A Nice Return On Capital Employed

Today we’ll look at Hutter & Schrantz Stahlbau AG (VIE:HST) and reflect on its potential as an investment. In particular, we’ll consider its Return On Capital Employed (ROCE), as that can give us insight into how profitably the company is able to employ capital in its business.
First of all, we’ll work out how to calculate ROCE. Then we’ll compare its ROCE to similar companies. Last but not least, we’ll look at what impact its current liabilities have on its ROCE.
Understanding Return On Capital Employed (ROCE)
ROCE is a measure of a company’s yearly pre-tax profit (its return), relative to the capital employed in the business. In general, businesses with a higher ROCE are usually better quality. In brief, it is a useful tool, but it is not without drawbacks. Author Edwin Whiting says to be careful when comparing the ROCE of different businesses, since ‘No two businesses are exactly alike.’
How Do You Calculate Return On Capital Employed?
The formula for calculating the return on capital employed is:
Return on Capital Employed = Earnings Before Interest and Tax (EBIT) ÷ (Total Assets – Current Liabilities)
Or for Hutter & Schrantz Stahlbau:
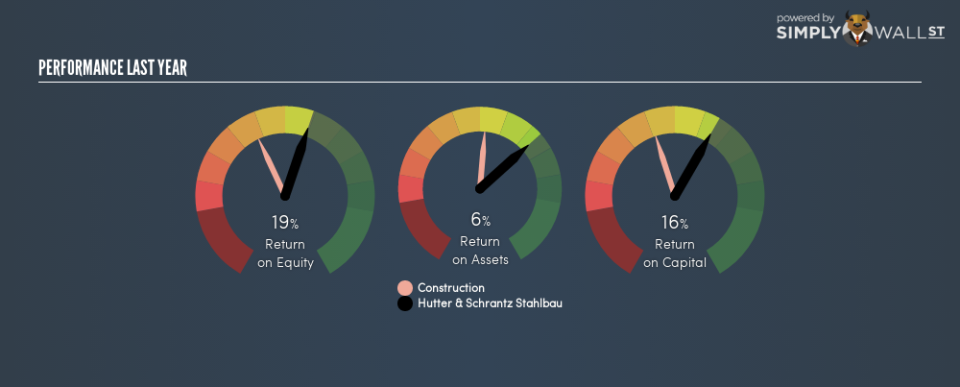
0.16 = €10m ÷ (€89m – €24m) (Based on the trailing twelve months to December 2017.)
So, Hutter & Schrantz Stahlbau has an ROCE of 16%.
View our latest analysis for Hutter & Schrantz Stahlbau
Want to help shape the future of investing tools and platforms? Take the survey and be part of one of the most advanced studies of stock market investors to date.
Is Hutter & Schrantz Stahlbau’s ROCE Good?
ROCE is commonly used for comparing the performance of similar businesses. In our analysis, Hutter & Schrantz Stahlbau’s ROCE is meaningfully higher than the 11% average in the Construction industry. We consider this a positive sign, because it suggests it uses capital more efficiently than similar companies. Regardless of where Hutter & Schrantz Stahlbau sits next to its industry, its ROCE in absolute terms appears satisfactory, and this company could be worth a closer look.
As we can see, Hutter & Schrantz Stahlbau currently has an ROCE of 16% compared to its ROCE 3 years ago, which was 9.9%. This makes us think about whether the company has been reinvesting shrewdly.
It is important to remember that ROCE shows past performance, and is not necessarily predictive. ROCE can be deceptive for cyclical businesses, as returns can look incredible in boom times, and terribly low in downturns. ROCE is, after all, simply a snap shot of a single year. If Hutter & Schrantz Stahlbau is cyclical, it could make sense to check out this free graph of past earnings, revenue and cash flow.
Do Hutter & Schrantz Stahlbau’s Current Liabilities Skew Its ROCE?
Liabilities, such as supplier bills and bank overdrafts, are referred to as current liabilities if they need to be paid within 12 months. The ROCE equation subtracts current liabilities from capital employed, so a company with a lot of current liabilities appears to have less capital employed, and a higher ROCE than otherwise. To counteract this, we check if a company has high current liabilities, relative to its total assets.
Hutter & Schrantz Stahlbau has total liabilities of €24m and total assets of €89m. Therefore its current liabilities are equivalent to approximately 27% of its total assets. A fairly low level of current liabilities is not influencing the ROCE too much.
Our Take On Hutter & Schrantz Stahlbau’s ROCE
With that in mind, Hutter & Schrantz Stahlbau’s ROCE appears pretty good. Of course, you might find a fantastic investment by looking at a few good candidates. So take a peek at this free list of companies with modest (or no) debt, trading on a P/E below 20.
If you are like me, then you will not want to miss this free list of growing companies that insiders are buying.
To help readers see past the short term volatility of the financial market, we aim to bring you a long-term focused research analysis purely driven by fundamental data. Note that our analysis does not factor in the latest price-sensitive company announcements.
The author is an independent contributor and at the time of publication had no position in the stocks mentioned. For errors that warrant correction please contact the editor at editorial-team@simplywallst.com.

