How Do Hydrogen Group Plc’s (LON:HYDG) Returns On Capital Compare To Peers?

Want to participate in a short research study? Help shape the future of investing tools and you could win a $250 gift card!
Today we'll look at Hydrogen Group Plc (LON:HYDG) and reflect on its potential as an investment. To be precise, we'll consider its Return On Capital Employed (ROCE), as that will inform our view of the quality of the business.
First up, we'll look at what ROCE is and how we calculate it. Next, we'll compare it to others in its industry. And finally, we'll look at how its current liabilities are impacting its ROCE.
What is Return On Capital Employed (ROCE)?
ROCE is a metric for evaluating how much pre-tax income (in percentage terms) a company earns on the capital invested in its business. Generally speaking a higher ROCE is better. Overall, it is a valuable metric that has its flaws. Renowned investment researcher Michael Mauboussin has suggested that a high ROCE can indicate that 'one dollar invested in the company generates value of more than one dollar'.
How Do You Calculate Return On Capital Employed?
Analysts use this formula to calculate return on capital employed:
Return on Capital Employed = Earnings Before Interest and Tax (EBIT) ÷ (Total Assets - Current Liabilities)
Or for Hydrogen Group:
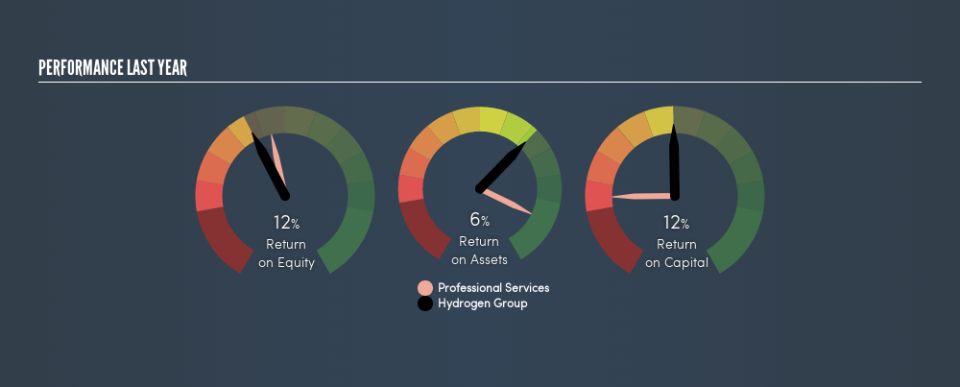
0.12 = UK£2.8m ÷ (UK£39m - UK£16m) (Based on the trailing twelve months to December 2018.)
Therefore, Hydrogen Group has an ROCE of 12%.
View our latest analysis for Hydrogen Group
Is Hydrogen Group's ROCE Good?
ROCE can be useful when making comparisons, such as between similar companies. In this analysis, Hydrogen Group's ROCE appears meaningfully below the 18% average reported by the Professional Services industry. This performance is not ideal, as it suggests the company may not be deploying its capital as effectively as some competitors. Regardless of where Hydrogen Group sits next to its industry, its ROCE in absolute terms appears satisfactory, and this company could be worth a closer look.
In our analysis, Hydrogen Group's ROCE appears to be 12%, compared to 3 years ago, when its ROCE was 1.1%. This makes us wonder if the company is improving.
When considering this metric, keep in mind that it is backwards looking, and not necessarily predictive. ROCE can be deceptive for cyclical businesses, as returns can look incredible in boom times, and terribly low in downturns. This is because ROCE only looks at one year, instead of considering returns across a whole cycle. What happens in the future is pretty important for investors, so we have prepared a free report on analyst forecasts for Hydrogen Group.
How Hydrogen Group's Current Liabilities Impact Its ROCE
Current liabilities include invoices, such as supplier payments, short-term debt, or a tax bill, that need to be paid within 12 months. Due to the way ROCE is calculated, a high level of current liabilities makes a company look as though it has less capital employed, and thus can (sometimes unfairly) boost the ROCE. To counteract this, we check if a company has high current liabilities, relative to its total assets.
Hydrogen Group has total liabilities of UK£16m and total assets of UK£39m. Therefore its current liabilities are equivalent to approximately 40% of its total assets. Hydrogen Group has a middling amount of current liabilities, increasing its ROCE somewhat.
The Bottom Line On Hydrogen Group's ROCE
While its ROCE looks good, it's worth remembering that the current liabilities are making the business look better. There might be better investments than Hydrogen Group out there, but you will have to work hard to find them . These promising businesses with rapidly growing earnings might be right up your alley.
If you like to buy stocks alongside management, then you might just love this free list of companies. (Hint: insiders have been buying them).
We aim to bring you long-term focused research analysis driven by fundamental data. Note that our analysis may not factor in the latest price-sensitive company announcements or qualitative material.
If you spot an error that warrants correction, please contact the editor at editorial-team@simplywallst.com. This article by Simply Wall St is general in nature. It does not constitute a recommendation to buy or sell any stock, and does not take account of your objectives, or your financial situation. Simply Wall St has no position in the stocks mentioned. Thank you for reading.
