What Can We Make Of IES Holdings, Inc.’s (NASDAQ:IESC) High Return On Capital?

Today we are going to look at IES Holdings, Inc. (NASDAQ:IESC) to see whether it might be an attractive investment prospect. Specifically, we'll consider its Return On Capital Employed (ROCE), since that will give us an insight into how efficiently the business can generate profits from the capital it requires.
First up, we'll look at what ROCE is and how we calculate it. Second, we'll look at its ROCE compared to similar companies. Last but not least, we'll look at what impact its current liabilities have on its ROCE.
Understanding Return On Capital Employed (ROCE)
ROCE measures the amount of pre-tax profits a company can generate from the capital employed in its business. All else being equal, a better business will have a higher ROCE. Ultimately, it is a useful but imperfect metric. Renowned investment researcher Michael Mauboussin has suggested that a high ROCE can indicate that 'one dollar invested in the company generates value of more than one dollar'.
So, How Do We Calculate ROCE?
Analysts use this formula to calculate return on capital employed:
Return on Capital Employed = Earnings Before Interest and Tax (EBIT) ÷ (Total Assets - Current Liabilities)
Or for IES Holdings:
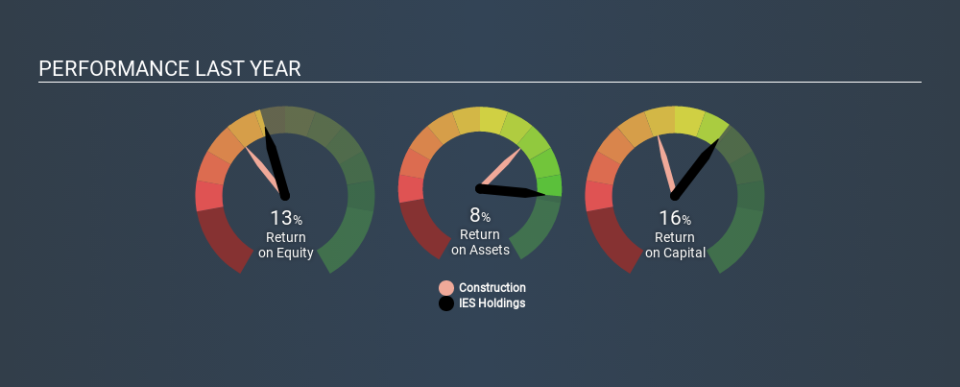
0.16 = US$42m ÷ (US$445m - US$193m) (Based on the trailing twelve months to September 2019.)
So, IES Holdings has an ROCE of 16%.
See our latest analysis for IES Holdings
Is IES Holdings's ROCE Good?
One way to assess ROCE is to compare similar companies. Using our data, we find that IES Holdings's ROCE is meaningfully better than the 11% average in the Construction industry. I think that's good to see, since it implies the company is better than other companies at making the most of its capital. Separate from IES Holdings's performance relative to its industry, its ROCE in absolute terms looks satisfactory, and it may be worth researching in more depth.
We can see that, IES Holdings currently has an ROCE of 16% compared to its ROCE 3 years ago, which was 10%. This makes us think about whether the company has been reinvesting shrewdly. The image below shows how IES Holdings's ROCE compares to its industry, and you can click it to see more detail on its past growth.
When considering this metric, keep in mind that it is backwards looking, and not necessarily predictive. Companies in cyclical industries can be difficult to understand using ROCE, as returns typically look high during boom times, and low during busts. ROCE is only a point-in-time measure. If IES Holdings is cyclical, it could make sense to check out this free graph of past earnings, revenue and cash flow.
What Are Current Liabilities, And How Do They Affect IES Holdings's ROCE?
Liabilities, such as supplier bills and bank overdrafts, are referred to as current liabilities if they need to be paid within 12 months. The ROCE equation subtracts current liabilities from capital employed, so a company with a lot of current liabilities appears to have less capital employed, and a higher ROCE than otherwise. To counteract this, we check if a company has high current liabilities, relative to its total assets.
IES Holdings has total assets of US$445m and current liabilities of US$193m. As a result, its current liabilities are equal to approximately 43% of its total assets. With this level of current liabilities, IES Holdings's ROCE is boosted somewhat.
What We Can Learn From IES Holdings's ROCE
IES Holdings's ROCE does look good, but the level of current liabilities also contribute to that. IES Holdings looks strong on this analysis, but there are plenty of other companies that could be a good opportunity . Here is a free list of companies growing earnings rapidly.
For those who like to find winning investments this free list of growing companies with recent insider purchasing, could be just the ticket.
If you spot an error that warrants correction, please contact the editor at editorial-team@simplywallst.com. This article by Simply Wall St is general in nature. It does not constitute a recommendation to buy or sell any stock, and does not take account of your objectives, or your financial situation. Simply Wall St has no position in the stocks mentioned.
We aim to bring you long-term focused research analysis driven by fundamental data. Note that our analysis may not factor in the latest price-sensitive company announcements or qualitative material. Thank you for reading.
