Is IFGL Refractories Limited's (NSE:IFGLEXPOR) P/E Ratio Really That Good?

This article is written for those who want to get better at using price to earnings ratios (P/E ratios). We'll apply a basic P/E ratio analysis to IFGL Refractories Limited's (NSE:IFGLEXPOR), to help you decide if the stock is worth further research. Looking at earnings over the last twelve months, IFGL Refractories has a P/E ratio of 10.67. That corresponds to an earnings yield of approximately 9.4%.
View our latest analysis for IFGL Refractories
How Do I Calculate A Price To Earnings Ratio?
The formula for P/E is:
Price to Earnings Ratio = Price per Share ÷ Earnings per Share (EPS)
Or for IFGL Refractories:
P/E of 10.67 = ₹149.4 ÷ ₹14 (Based on the year to March 2019.)
Is A High Price-to-Earnings Ratio Good?
A higher P/E ratio means that buyers have to pay a higher price for each ₹1 the company has earned over the last year. All else being equal, it's better to pay a low price -- but as Warren Buffett said, 'It's far better to buy a wonderful company at a fair price than a fair company at a wonderful price.'
Does IFGL Refractories Have A Relatively High Or Low P/E For Its Industry?
One good way to get a quick read on what market participants expect of a company is to look at its P/E ratio. If you look at the image below, you can see IFGL Refractories has a lower P/E than the average (20.1) in the basic materials industry classification.
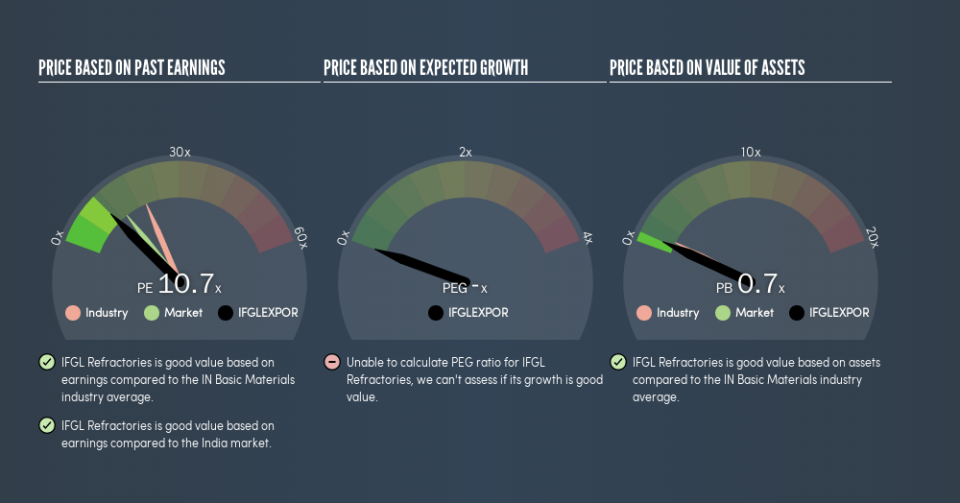
Its relatively low P/E ratio indicates that IFGL Refractories shareholders think it will struggle to do as well as other companies in its industry classification. Since the market seems unimpressed with IFGL Refractories, it's quite possible it could surprise on the upside. If you consider the stock interesting, further research is recommended. For example, I often monitor director buying and selling.
How Growth Rates Impact P/E Ratios
If earnings fall then in the future the 'E' will be lower. Therefore, even if you pay a low multiple of earnings now, that multiple will become higher in the future. A higher P/E should indicate the stock is expensive relative to others -- and that may encourage shareholders to sell.
IFGL Refractories's earnings per share grew by -7.1% in the last twelve months. In contrast, EPS has decreased by 2.7%, annually, over 5 years.
A Limitation: P/E Ratios Ignore Debt and Cash In The Bank
Don't forget that the P/E ratio considers market capitalization. Thus, the metric does not reflect cash or debt held by the company. Theoretically, a business can improve its earnings (and produce a lower P/E in the future) by investing in growth. That means taking on debt (or spending its cash).
Such expenditure might be good or bad, in the long term, but the point here is that the balance sheet is not reflected by this ratio.
IFGL Refractories's Balance Sheet
IFGL Refractories has net cash of ₹431m. That should lead to a higher P/E than if it did have debt, because its strong balance sheets gives it more options.
The Verdict On IFGL Refractories's P/E Ratio
IFGL Refractories's P/E is 10.7 which is below average (13.6) in the IN market. Earnings improved over the last year. And the net cash position gives the company many options. So it's strange that the low P/E indicates low expectations.
When the market is wrong about a stock, it gives savvy investors an opportunity. As value investor Benjamin Graham famously said, 'In the short run, the market is a voting machine but in the long run, it is a weighing machine.' We don't have analyst forecasts, but shareholders might want to examine this detailed historical graph of earnings, revenue and cash flow.
Of course, you might find a fantastic investment by looking at a few good candidates. So take a peek at this free list of companies with modest (or no) debt, trading on a P/E below 20.
We aim to bring you long-term focused research analysis driven by fundamental data. Note that our analysis may not factor in the latest price-sensitive company announcements or qualitative material.
If you spot an error that warrants correction, please contact the editor at editorial-team@simplywallst.com. This article by Simply Wall St is general in nature. It does not constitute a recommendation to buy or sell any stock, and does not take account of your objectives, or your financial situation. Simply Wall St has no position in the stocks mentioned. Thank you for reading.

