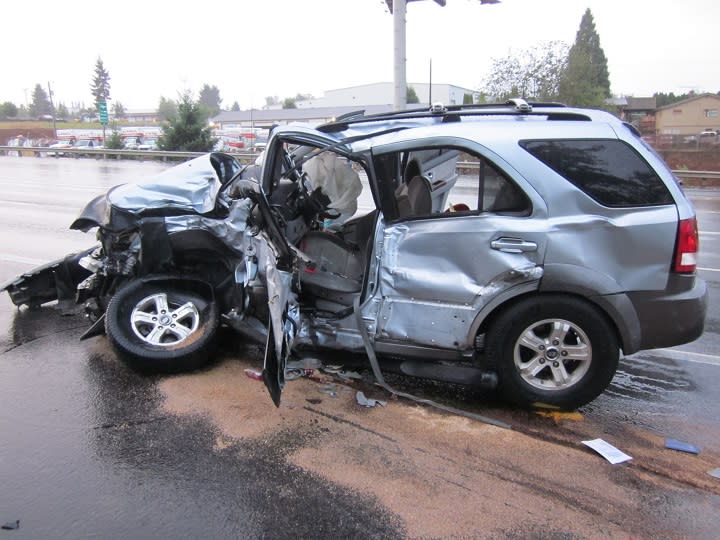
IIHS Study Shows Driver Death Rates Increasing as Economy Improves
A recent study conducted by the Insurance Institute for Highway Safety (IIHS) reports that the risk of dying in a crash in a late-model vehicle has gone up slightly. According to the study, this is largely due to a rebounding economy, which encourages more driving—and perhaps more reckless driving. However, the IIHS further predicts, based on expected changes in the economy, that U.S. traffic deaths will drop slightly over the next few years.
The IIHS reports that the death rate for the 2014 model year was 30 per 1 million registered vehicle years, compared with 28 per million for 2011 models. However, the death rate for individual vehicle makes and models varies considerably. Eleven vehicle models register no deaths, while the highest death rate belongs to the Hyundai Accent, with 104 deaths per million registered vehicle years for the 2014 model year.

The previous IIHS driver death rate calculation indicated an overall drop of more than one third, in three years, mainly due to improvements in safety technology and vehicle designs. While these two areas continue to evolve, recent improvement have not sufficed to bring traffic deaths down in this new calculation. The new driver death rates are based on deaths that occurred during 2012 through 2015. Although traffic fatalities have been on a steady decline since the early 1970s, they ticked up about 7% in 2015, and preliminary data indicate that the death toll increased again in 2016.
“Vehicles continue to improve, performing better and better in crash tests,” said David Zuby, IIHS executive vice president and chief research officer. “The latest driver death rates show there is a limit to how much these changes can accomplish without other kinds of efforts.”
Employment Drives Drivers
According to the IIHS, increases in traffic deaths are to be expected when the national economy improves, since more employed people means more drivers on the road—whether commuting or doing “discretionary driving” associated with leisure activities. People also tend to drive faster when economic conditions are positive.
Charles Farmer, IIHS vice president for research and statistical services, has designed a statistical model based on the connection between traffic deaths and unemployment since 1990. To estimate how the annual death toll might change in the coming years, Farmer devised a model that takes into account safety improvements and changes in the unemployment rate.
The IIHS reports that Farmer found that a decline in the unemployment rate from 6 to 5% is associated with a 2% increase in vehicle miles traveled—and a 2% increase in fatalities. That jump in exposure leads to an equivalent 2% jump in fatalities. Thus, given the U.S. Bureau of Labor Statistics' forecast of a 1.7% annual reduction in unemployment from 2014 to 2024, Farmer predicts that the recent increase in deaths will have peaked in 2016. He projects a total of 34,400 traffic deaths in 2024, down from 35,092 in 2015, despite inevitable increases in population. This will still be higher than 2014’s figure: 32,744.
Smaller Vehicles Equals Higher Death Rates, But Smaller Vehicles Improving
According to the study, generally speaking, the smaller the vehicle, the higher the death rate. Of the 10 models with the highest death rates, the IIHS classifies five as mini cars and three as small cars. Large luxury SUVs that feature 4-wheel drive have the lowest overall death rate.
Despite the increase in the overall driver death rate, the models with the highest rates have seen some improvement in recent years. The 2014 Hyundai Accent's death rate of 104 compares with 120 for the 2011 Accent. The highest fatality rate among the 2011 models belonged to the Kia Rio: 149. The 2014 Rio's death rate is 102. Both models were redesigned in 2012, and the IIHS notes that their lower death rates may reflect the better crash-test performance of the newer designs.
The IIHS has been publishing death rates per registered vehicle year by make and model since 1989. The rates include only driver deaths because all vehicles on the road have drivers, while not all of them have passengers or the same number of passengers. Fatality counts are taken from the federal Fatality Analysis Reporting System, and registration data are from IHS Automotive. The calculated rates are adjusted for driver age and gender.
Although the numbers reflect 2014 models, data from earlier models as far back as 2011 are included if the vehicles weren't substantially redesigned before 2014, to increase the reliability of results. To be included, a vehicle must have had at least 100,000 registered vehicle years of exposure during 2012-2015 or at least 20 deaths.
Abstract:
A recent study conducted by the Insurance Institute for Highway Safety (IIHS) reports that the risk of dying in a crash in a late-model vehicle has gone up slightly.
Year:
2 017
Check this if this is NOT an Articles Listing Page:
Display Article Date?:
Article Is Flipbook:
No

 Yahoo Autos
