Can You Imagine How Gildan Activewear's (TSE:GIL) Shareholders Feel About The 63% Share Price Increase?

Generally speaking the aim of active stock picking is to find companies that provide returns that are superior to the market average. Buying under-rated businesses is one path to excess returns. For example, the Gildan Activewear Inc. (TSE:GIL) share price is up 63% in the last 5 years, clearly besting than the market return of around -0.2% (ignoring dividends). However, more recent returns haven't been as impressive as that, with the stock returning just 28% in the last year, including dividends.
View our latest analysis for Gildan Activewear
While markets are a powerful pricing mechanism, share prices reflect investor sentiment, not just underlying business performance. One imperfect but simple way to consider how the market perception of a company has shifted is to compare the change in the earnings per share (EPS) with the share price movement.
Over half a decade, Gildan Activewear managed to grow its earnings per share at 0.9% a year. This EPS growth is slower than the share price growth of 10% per year, over the same period. So it's fair to assume the market has a higher opinion of the business than it did five years ago. And that's hardly shocking given the track record of growth.
The graphic below depicts how EPS has changed over time (unveil the exact values by clicking on the image).
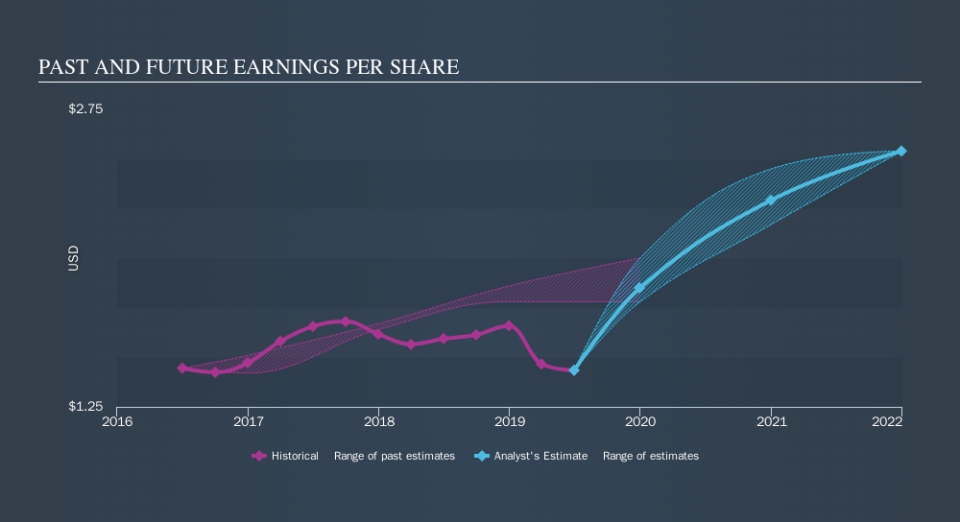
Before buying or selling a stock, we always recommend a close examination of historic growth trends, available here..
What About Dividends?
As well as measuring the share price return, investors should also consider the total shareholder return (TSR). Whereas the share price return only reflects the change in the share price, the TSR includes the value of dividends (assuming they were reinvested) and the benefit of any discounted capital raising or spin-off. It's fair to say that the TSR gives a more complete picture for stocks that pay a dividend. We note that for Gildan Activewear the TSR over the last 5 years was 73%, which is better than the share price return mentioned above. This is largely a result of its dividend payments!
A Different Perspective
We're pleased to report that Gildan Activewear shareholders have received a total shareholder return of 28% over one year. And that does include the dividend. Since the one-year TSR is better than the five-year TSR (the latter coming in at 12% per year), it would seem that the stock's performance has improved in recent times. Given the share price momentum remains strong, it might be worth taking a closer look at the stock, lest you miss an opportunity. If you would like to research Gildan Activewear in more detail then you might want to take a look at whether insiders have been buying or selling shares in the company.
If you are like me, then you will not want to miss this free list of growing companies that insiders are buying.
Please note, the market returns quoted in this article reflect the market weighted average returns of stocks that currently trade on CA exchanges.
We aim to bring you long-term focused research analysis driven by fundamental data. Note that our analysis may not factor in the latest price-sensitive company announcements or qualitative material.
If you spot an error that warrants correction, please contact the editor at editorial-team@simplywallst.com. This article by Simply Wall St is general in nature. It does not constitute a recommendation to buy or sell any stock, and does not take account of your objectives, or your financial situation. Simply Wall St has no position in the stocks mentioned. Thank you for reading.
