Imagine Owning Harvey Norman Holdings (ASX:HVN) And Wondering If The 36% Share Price Slide Is Justified

For many, the main point of investing is to generate higher returns than the overall market. But the main game is to find enough winners to more than offset the losers At this point some shareholders may be questioning their investment in Harvey Norman Holdings Limited (ASX:HVN), since the last five years saw the share price fall 36%. And some of the more recent buyers are probably worried, too, with the stock falling 27% in the last year. Furthermore, it's down 32% in about a quarter. That's not much fun for holders. However, one could argue that the price has been influenced by the general market, which is down 23% in the same timeframe.
View our latest analysis for Harvey Norman Holdings
To paraphrase Benjamin Graham: Over the short term the market is a voting machine, but over the long term it's a weighing machine. One way to examine how market sentiment has changed over time is to look at the interaction between a company's share price and its earnings per share (EPS).
During the unfortunate half decade during which the share price slipped, Harvey Norman Holdings actually saw its earnings per share (EPS) improve by 7.9% per year. So it doesn't seem like EPS is a great guide to understanding how the market is valuing the stock. Alternatively, growth expectations may have been unreasonable in the past.
Due to the lack of correlation between the EPS growth and the falling share price, it's worth taking a look at other metrics to try to understand the share price movement.
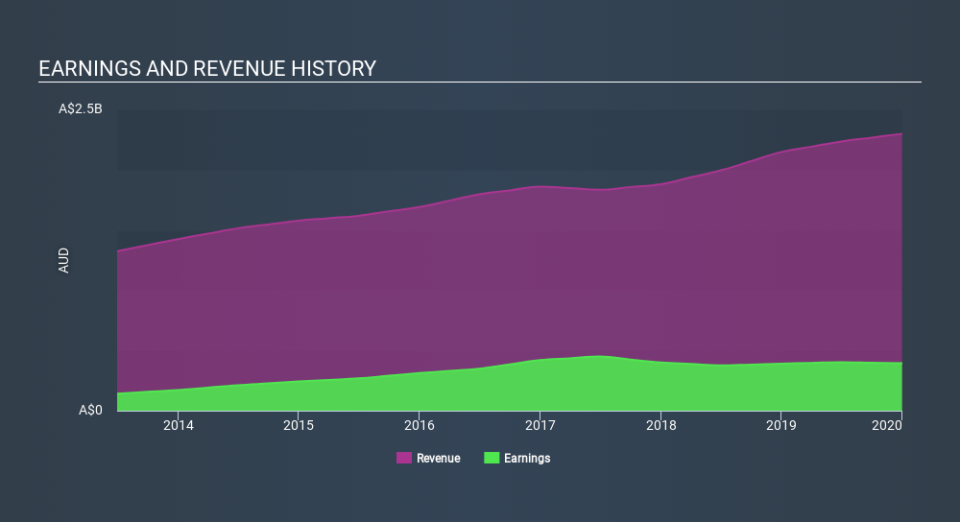
In contrast to the share price, revenue has actually increased by 7.5% a year in the five year period. So it seems one might have to take closer look at the fundamentals to understand why the share price languishes. After all, there may be an opportunity.
You can see how earnings and revenue have changed over time in the image below (click on the chart to see the exact values).
It's probably worth noting we've seen significant insider buying in the last quarter, which we consider a positive. That said, we think earnings and revenue growth trends are even more important factors to consider. This free report showing analyst forecasts should help you form a view on Harvey Norman Holdings
What about the Total Shareholder Return (TSR)?
Investors should note that there's a difference between Harvey Norman Holdings's total shareholder return (TSR) and its share price change, which we've covered above. The TSR is a return calculation that accounts for the value of cash dividends (assuming that any dividend received was reinvested) and the calculated value of any discounted capital raisings and spin-offs. Harvey Norman Holdings's TSR of was a loss of 9.0% for the 5 years. That wasn't as bad as its share price return, because it has paid dividends.
A Different Perspective
While the broader market lost about 12% in the twelve months, Harvey Norman Holdings shareholders did even worse, losing 22%. Having said that, it's inevitable that some stocks will be oversold in a falling market. The key is to keep your eyes on the fundamental developments. Unfortunately, last year's performance may indicate unresolved challenges, given that it was worse than the annualised loss of 1.9% over the last half decade. We realise that Baron Rothschild has said investors should "buy when there is blood on the streets", but we caution that investors should first be sure they are buying a high quality business. It's always interesting to track share price performance over the longer term. But to understand Harvey Norman Holdings better, we need to consider many other factors. For example, we've discovered 2 warning signs for Harvey Norman Holdings that you should be aware of before investing here.
If you like to buy stocks alongside management, then you might just love this free list of companies. (Hint: insiders have been buying them).
Please note, the market returns quoted in this article reflect the market weighted average returns of stocks that currently trade on AU exchanges.
If you spot an error that warrants correction, please contact the editor at editorial-team@simplywallst.com. This article by Simply Wall St is general in nature. It does not constitute a recommendation to buy or sell any stock, and does not take account of your objectives, or your financial situation. Simply Wall St has no position in the stocks mentioned.
We aim to bring you long-term focused research analysis driven by fundamental data. Note that our analysis may not factor in the latest price-sensitive company announcements or qualitative material. Thank you for reading.

