Imagine Owning Odd Molly International (STO:ODD) And Trying To Stomach The 95% Share Price Drop

As every investor would know, not every swing hits the sweet spot. But you have a problem if you face massive losses more than once in a while. So consider, for a moment, the misfortune of Odd Molly International AB (publ) (STO:ODD) investors who have held the stock for three years as it declined a whopping 95%. That would certainly shake our confidence in the decision to own the stock. And more recent buyers are having a tough time too, with a drop of 72% in the last year. Unfortunately the share price momentum is still quite negative, with prices down 53% in thirty days. However, we note the price may have been impacted by the broader market, which is down 31% in the same time period.
We really hope anyone holding through that price crash has a diversified portfolio. Even when you lose money, you don't have to lose the lesson.
See our latest analysis for Odd Molly International
Given that Odd Molly International didn't make a profit in the last twelve months, we'll focus on revenue growth to form a quick view of its business development. Generally speaking, companies without profits are expected to grow revenue every year, and at a good clip. That's because fast revenue growth can be easily extrapolated to forecast profits, often of considerable size.
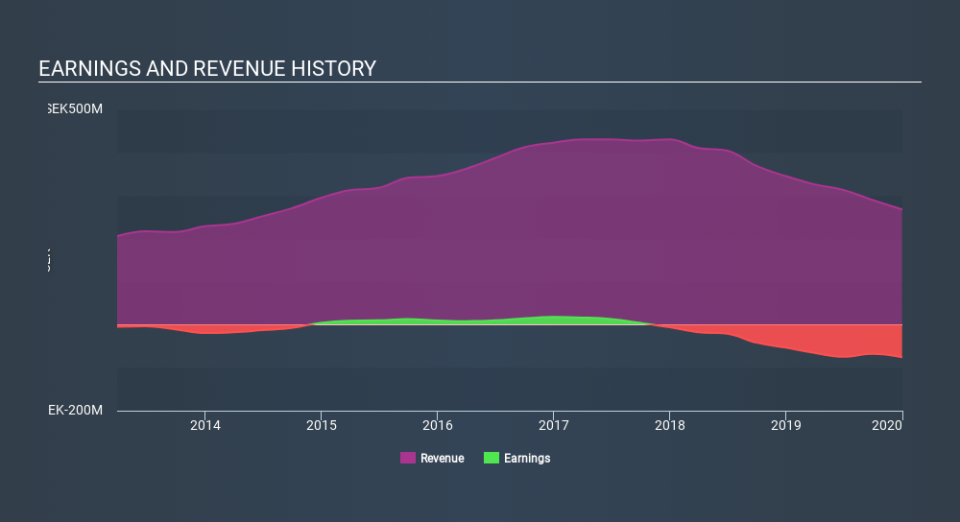
Over the last three years, Odd Molly International's revenue dropped 15% per year. That means its revenue trend is very weak compared to other loss making companies. And as you might expect the share price has been weak too, dropping at a rate of 63% per year. We prefer leave it to clowns to try to catch falling knives, like this stock. It's worth remembering that investors call buying a steeply falling share price 'catching a falling knife' because it is a dangerous pass time.
You can see below how earnings and revenue have changed over time (discover the exact values by clicking on the image).
Take a more thorough look at Odd Molly International's financial health with this free report on its balance sheet.
What about the Total Shareholder Return (TSR)?
We've already covered Odd Molly International's share price action, but we should also mention its total shareholder return (TSR). The TSR is a return calculation that accounts for the value of cash dividends (assuming that any dividend received was reinvested) and the calculated value of any discounted capital raisings and spin-offs. Its history of dividend payouts mean that Odd Molly International's TSR, which was a 94% drop over the last 3 years, was not as bad as the share price return.
A Different Perspective
We regret to report that Odd Molly International shareholders are down 68% for the year. Unfortunately, that's worse than the broader market decline of 12%. Having said that, it's inevitable that some stocks will be oversold in a falling market. The key is to keep your eyes on the fundamental developments. Regrettably, last year's performance caps off a bad run, with the shareholders facing a total loss of 41% per year over five years. Generally speaking long term share price weakness can be a bad sign, though contrarian investors might want to research the stock in hope of a turnaround. It's always interesting to track share price performance over the longer term. But to understand Odd Molly International better, we need to consider many other factors. For instance, we've identified 6 warning signs for Odd Molly International (4 are significant) that you should be aware of.
If you are like me, then you will not want to miss this free list of growing companies that insiders are buying.
Please note, the market returns quoted in this article reflect the market weighted average returns of stocks that currently trade on SE exchanges.
If you spot an error that warrants correction, please contact the editor at editorial-team@simplywallst.com. This article by Simply Wall St is general in nature. It does not constitute a recommendation to buy or sell any stock, and does not take account of your objectives, or your financial situation. Simply Wall St has no position in the stocks mentioned.
We aim to bring you long-term focused research analysis driven by fundamental data. Note that our analysis may not factor in the latest price-sensitive company announcements or qualitative material. Thank you for reading.
