Implications Of US Borrowing $3 Trillion In H1 2020

The US Treasury issued over $3 trillion in new debt securities in the first half of 2020 as the economy reeled from the pandemic. We have three critical questions about this exercise. Where is the money going? Who is buying all that debt? And, why does it matter who the buyers are?
Where is the Federal Government Spending the Money?
To analyze the impact on the economic disruption caused by the pandemic, we divide the expenditures of the US Federal Government into three categories.
First, how much of the money is going to individuals? Federal Government programs such as social security, unemployment insurance and food stamps are considered transfer payments – payments made without goods or services being received in return. About half of the expenditures of the US Federal Government go to individuals through these social safety net programs. These payments increased dramatically in the first half of 2020 to $1.8 trillion, which is about a 55% increase over the 2019 run-rate.
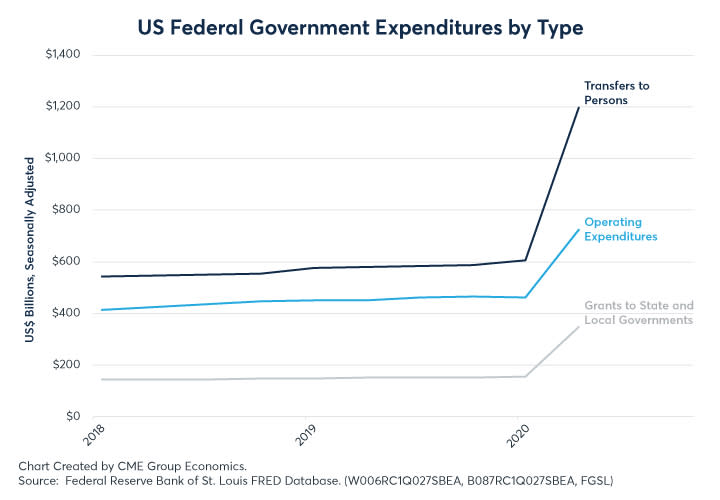
Second, how much of the money is going to state and local governments in the form of grants? Grants to state and local authorities are an important category for analyzing the pandemic response. States and local governments are on the frontlines of handling the pandemic and their revenue sources have been severely impaired. Income tax receipts are down as unemployment has risen. Sales tax receipts are down as many businesses were forced to close and are now re-opening slowly. Property tax receipts are down as there have been official programs to allow delayed payments, and some payments are simply being missed due to financial distress. The point is that state and local governments need federal support to keep functioning, and without having to lay off workers as they did in size after the Great Recession of 2008-2009. In the first half of 2020, Federal Government grants to states and local authorities were about $500 billion, or about 65% above the 2019 run-rate.
Third, how much money is going to other government expenditures? This is a broad category that contains the expenditures to run Federal agencies, including the Defense Department as well as new pandemic programs such as loans to small businesses (Paycheck Protection Program), loans to large businesses, allocations to pharmaceutical companies to ramp up vaccine production, etc. In the first half of 2020, all other Federal Government expenses totaled $1.2 trillion, about 30% above the 2019 run-rate.
Who is buying all the newly issued US Treasury Debt?
The US Treasury issued just over $3.3 trillion in new debt securities in the first half of 2020. Federal Government expenditures were rising rapidly as discussed above, and revenues were depressed from lower and delayed income and corporate tax payments.


So, who bought all this newly issued debt? The largest buyers were private investors, which includes asset managers and hedge funds, both domestic and international, who took up almost $1.8 trillion of the debt. A close second was the US Federal Reserve (Fed) which bought almost $1.6 trillion or 46% of the new debt issued. Interestingly, central banks around the world, which hold trillions of dollars of US Treasuries in their foreign reserve portfolios, were not involved in buying US Treasury securities in the first half of 2020.
Why Does it Matter who Buys the Debt?
The Fed’s support of the US Treasury involves a fusion of monetary and fiscal policy in the US not seen since World War II that ended in 1951 with “The Accord,” which granted the Fed independence from the US Treasury in setting interest rate policy. This puts the US firmly in the camp of Modern Monetary Theory (MMT), which argues that the Fed can and should be a partner in financing Federal Government expenditures.
If the Fed had not stepped up to the plate and bought almost half of the new Treasury debt issuance, most economists would argue that the massive new supply would have overwhelmed demand and led to lower prices (higher yields). How much higher yields would have been without the Fed buying is open to intense debate. Yet, is it highly unusual for longer-term Treasury yields to drop below the prevailing rate of core inflation without Fed intervention in the Treasury markets. By this measure, for example, the Fed may have pushed the yield on the US Treasury 10-year bill down from the 1.0% core inflation territory in the pandemic period to just over 0.5%, or perhaps 50 basis points lower yield than might otherwise have been. To the extent that certain sensitive and related markets, such as the gold rally and US dollar depreciation, are sending signals of rising long-term inflation expectations, it is possible that yields might have been even higher than indicated by using historical inflation as the guide.

Aside from lower yields on Treasury securities, the Fed’s fusion of monetary policy with expansionary fiscal policy has lowered volatility in the Treasury markets and reduced the hurdle rate or competitive bar compared to equities, and thus supported a very strong equity market rally.
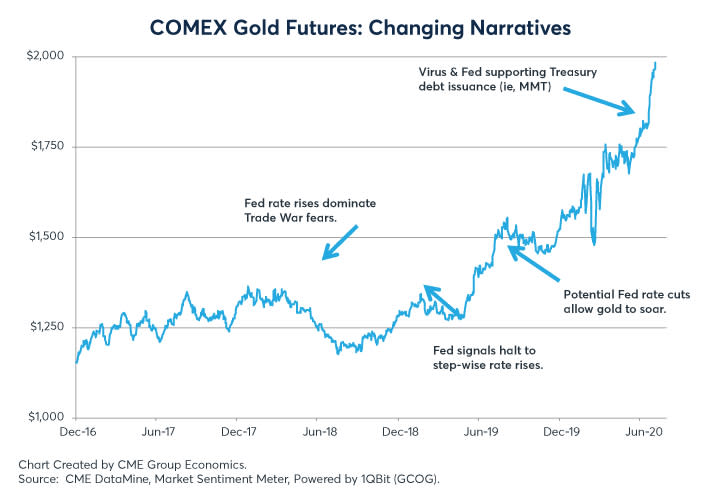

Another consequence is that the shape of the yield curve may no longer be a reliable indicator of the relative ease or tightness of monetary policy. The price signals from the Treasury yield curve are now a complicated combination of Fed policy and investor demand. That is, as noted above, the yield curve might have been much more positively sloped, signaling an easier policy stance, had the Fed not financed almost half of the expansion in fiscal policy. That is, the degree of monetary policy easing may be underestimated by the yield curve, although still appreciated and reflected by gold and US dollar market participants, as the controlling narratives in the markets dynamically evolve. The bottom line here is the fusion of monetary and fiscal policy and embrace of Modern Monetary Theory may be leading to increases in long-term US inflation expectations that are reflected in rising gold prices and a weaker US dollar, but not reflected in the Treasury securities prices or the yield curve.
To learn more about futures and options, go to Benzinga’s futures and options education resource.
See more from Benzinga
© 2020 Benzinga.com. Benzinga does not provide investment advice. All rights reserved.

