Should You Be Impressed By European Eltech Public Joint Stock Company's (MCX:EELT) ROE?

While some investors are already well versed in financial metrics (hat tip), this article is for those who would like to learn about Return On Equity (ROE) and why it is important. By way of learning-by-doing, we'll look at ROE to gain a better understanding of European Eltech Public Joint Stock Company (MCX:EELT).
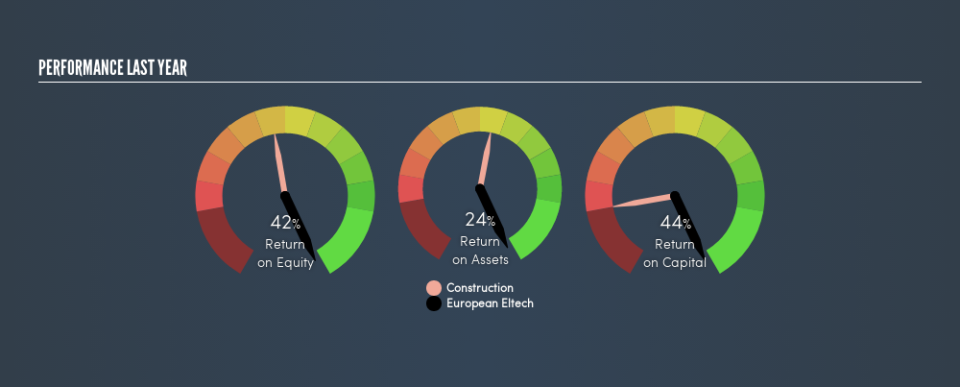
Our data shows European Eltech has a return on equity of 42% for the last year. One way to conceptualize this, is that for each RUB1 of shareholders' equity it has, the company made RUB0.42 in profit.
Want to participate in a short research study? Help shape the future of investing tools and you could win a $250 gift card!
View our latest analysis for European Eltech
How Do I Calculate ROE?
The formula for ROE is:
Return on Equity = Net Profit ÷ Shareholders' Equity
Or for European Eltech:
42% = RUруб296m ÷ RUруб695m (Based on the trailing twelve months to December 2018.)
It's easy to understand the 'net profit' part of that equation, but 'shareholders' equity' requires further explanation. It is the capital paid in by shareholders, plus any retained earnings. Shareholders' equity can be calculated by subtracting the total liabilities of the company from the total assets of the company.
What Does Return On Equity Signify?
Return on Equity measures a company's profitability against the profit it has kept for the business (plus any capital injections). The 'return' is the yearly profit. The higher the ROE, the more profit the company is making. So, all else being equal, a high ROE is better than a low one. Clearly, then, one can use ROE to compare different companies.
Does European Eltech Have A Good ROE?
One simple way to determine if a company has a good return on equity is to compare it to the average for its industry. The limitation of this approach is that some companies are quite different from others, even within the same industry classification. Pleasingly, European Eltech has a superior ROE than the average (14%) company in the Construction industry.
That's clearly a positive. I usually take a closer look when a company has a better ROE than industry peers. One data point to check is if insiders have bought shares recently.
Why You Should Consider Debt When Looking At ROE
Companies usually need to invest money to grow their profits. That cash can come from retained earnings, issuing new shares (equity), or debt. In the case of the first and second options, the ROE will reflect this use of cash, for growth. In the latter case, the use of debt will improve the returns, but will not change the equity. Thus the use of debt can improve ROE, albeit along with extra risk in the case of stormy weather, metaphorically speaking.
European Eltech's Debt And Its 42% ROE
Although European Eltech does use debt, its debt to equity ratio of 0.13 is still low. When I see a high ROE, fuelled by only modest debt, I suspect the business is high quality. Judicious use of debt to improve returns can certainly be a good thing, although it does elevate risk slightly and reduce future optionality.
The Key Takeaway
Return on equity is a useful indicator of the ability of a business to generate profits and return them to shareholders. In my book the highest quality companies have high return on equity, despite low debt. If two companies have the same ROE, then I would generally prefer the one with less debt.
But when a business is high quality, the market often bids it up to a price that reflects this. It is important to consider other factors, such as future profit growth -- and how much investment is required going forward. So I think it may be worth checking this free this detailed graph of past earnings, revenue and cash flow .
But note: European Eltech may not be the best stock to buy. So take a peek at this free list of interesting companies with high ROE and low debt.
We aim to bring you long-term focused research analysis driven by fundamental data. Note that our analysis may not factor in the latest price-sensitive company announcements or qualitative material.
If you spot an error that warrants correction, please contact the editor at editorial-team@simplywallst.com. This article by Simply Wall St is general in nature. It does not constitute a recommendation to buy or sell any stock, and does not take account of your objectives, or your financial situation. Simply Wall St has no position in the stocks mentioned. Thank you for reading.

