Should You Be Impressed By Sika AG's (VTX:SIKA) ROE?

Want to participate in a short research study? Help shape the future of investing tools and you could win a $250 gift card!
One of the best investments we can make is in our own knowledge and skill set. With that in mind, this article will work through how we can use Return On Equity (ROE) to better understand a business. By way of learning-by-doing, we'll look at ROE to gain a better understanding of Sika AG (VTX:SIKA).
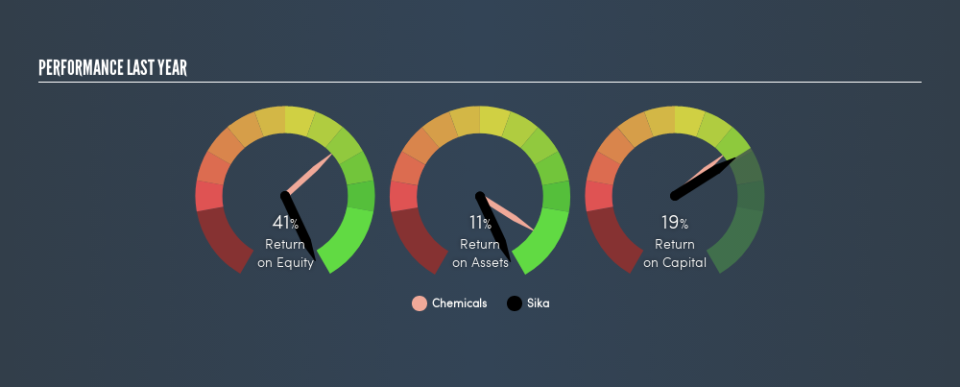
Our data shows Sika has a return on equity of 41% for the last year. Another way to think of that is that for every CHF1 worth of equity in the company, it was able to earn CHF0.41.
Check out our latest analysis for Sika
How Do You Calculate ROE?
The formula for return on equity is:
Return on Equity = Net Profit ÷ Shareholders' Equity
Or for Sika:
41% = CHF683m ÷ CHF1.7b (Based on the trailing twelve months to December 2018.)
Most readers would understand what net profit is, but it’s worth explaining the concept of shareholders’ equity. It is the capital paid in by shareholders, plus any retained earnings. You can calculate shareholders' equity by subtracting the company's total liabilities from its total assets.
What Does Return On Equity Signify?
ROE looks at the amount a company earns relative to the money it has kept within the business. The 'return' is the yearly profit. That means that the higher the ROE, the more profitable the company is. So, all else being equal, a high ROE is better than a low one. Clearly, then, one can use ROE to compare different companies.
Does Sika Have A Good ROE?
Arguably the easiest way to assess company's ROE is to compare it with the average in its industry. However, this method is only useful as a rough check, because companies do differ quite a bit within the same industry classification. As you can see in the graphic below, Sika has a higher ROE than the average (24%) in the Chemicals industry.
That's what I like to see. In my book, a high ROE almost always warrants a closer look. For example, I often check if insiders have been buying shares .
How Does Debt Impact Return On Equity?
Most companies need money -- from somewhere -- to grow their profits. That cash can come from retained earnings, issuing new shares (equity), or debt. In the first and second cases, the ROE will reflect this use of cash for investment in the business. In the latter case, the use of debt will improve the returns, but will not change the equity. In this manner the use of debt will boost ROE, even though the core economics of the business stay the same.
Sika's Debt And Its 41% ROE
It's worth noting the significant use of debt by Sika, leading to its debt to equity ratio of 1.81. While the ROE is impressive, that metric has clearly benefited from the company's use of debt. Debt does bring extra risk, so it's only really worthwhile when a company generates some decent returns from it.
The Key Takeaway
Return on equity is a useful indicator of the ability of a business to generate profits and return them to shareholders. Companies that can achieve high returns on equity without too much debt are generally of good quality. If two companies have around the same level of debt to equity, and one has a higher ROE, I'd generally prefer the one with higher ROE.
But ROE is just one piece of a bigger puzzle, since high quality businesses often trade on high multiples of earnings. The rate at which profits are likely to grow, relative to the expectations of profit growth reflected in the current price, must be considered, too. So you might want to check this FREE visualization of analyst forecasts for the company.
Of course Sika may not be the best stock to buy. So you may wish to see this free collection of other companies that have high ROE and low debt.
We aim to bring you long-term focused research analysis driven by fundamental data. Note that our analysis may not factor in the latest price-sensitive company announcements or qualitative material.
If you spot an error that warrants correction, please contact the editor at editorial-team@simplywallst.com. This article by Simply Wall St is general in nature. It does not constitute a recommendation to buy or sell any stock, and does not take account of your objectives, or your financial situation. Simply Wall St has no position in the stocks mentioned. Thank you for reading.

