Should You Be Impressed By Synergy Group Holdings International Limited’s (HKG:1539) ROE?

Want to participate in a short research study? Help shape the future of investing tools and you could win a $250 gift card!
Many investors are still learning about the various metrics that can be useful when analysing a stock. This article is for those who would like to learn about Return On Equity (ROE). By way of learning-by-doing, we’ll look at ROE to gain a better understanding of Synergy Group Holdings International Limited (HKG:1539).
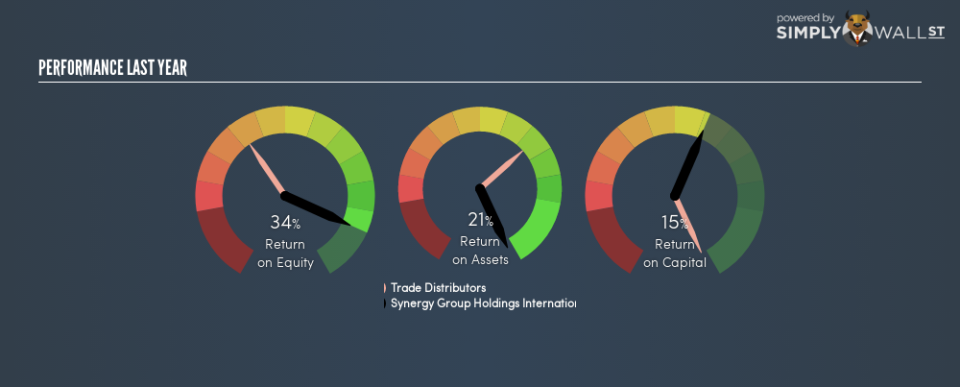
Our data shows Synergy Group Holdings International has a return on equity of 34% for the last year. One way to conceptualize this, is that for each HK$1 of shareholders’ equity it has, the company made HK$0.34 in profit.
View our latest analysis for Synergy Group Holdings International
How Do You Calculate ROE?
The formula for return on equity is:
Return on Equity = Net Profit ÷ Shareholders’ Equity
Or for Synergy Group Holdings International:
34% = 158.442 ÷ HK$459m (Based on the trailing twelve months to September 2018.)
Most know that net profit is the total earnings after all expenses, but the concept of shareholders’ equity is a little more complicated. It is the capital paid in by shareholders, plus any retained earnings. You can calculate shareholders’ equity by subtracting the company’s total liabilities from its total assets.
What Does Return On Equity Signify?
ROE measures a company’s profitability against the profit it retains, and any outside investments. The ‘return’ is the profit over the last twelve months. That means that the higher the ROE, the more profitable the company is. So, all else being equal, a high ROE is better than a low one. That means it can be interesting to compare the ROE of different companies.
Does Synergy Group Holdings International Have A Good Return On Equity?
By comparing a company’s ROE with its industry average, we can get a quick measure of how good it is. Importantly, this is far from a perfect measure, because companies differ significantly within the same industry classification. As you can see in the graphic below, Synergy Group Holdings International has a higher ROE than the average (11%) in the Trade Distributors industry.
That’s what I like to see. I usually take a closer look when a company has a better ROE than industry peers. One data point to check is if insiders have bought shares recently.
How Does Debt Impact ROE?
Companies usually need to invest money to grow their profits. That cash can come from retained earnings, issuing new shares (equity), or debt. In the first and second cases, the ROE will reflect this use of cash for investment in the business. In the latter case, the use of debt will improve the returns, but will not change the equity. That will make the ROE look better than if no debt was used.
Combining Synergy Group Holdings International’s Debt And Its 34% Return On Equity
Synergy Group Holdings International has a debt to equity ratio of 0.57, which is far from excessive. The combination of modest debt and a very impressive ROE does suggest that the business is high quality. Conservative use of debt to boost returns is usually a good move for shareholders, though it does leave the company more exposed to interest rate rises.
The Key Takeaway
Return on equity is one way we can compare the business quality of different companies. In my book the highest quality companies have high return on equity, despite low debt. All else being equal, a higher ROE is better.
But when a business is high quality, the market often bids it up to a price that reflects this. The rate at which profits are likely to grow, relative to the expectations of profit growth reflected in the current price, must be considered, too. You can see how the company has grow in the past by looking at this FREE detailed graph of past earnings, revenue and cash flow.
Of course Synergy Group Holdings International may not be the best stock to buy. So you may wish to see this free collection of other companies that have high ROE and low debt.
To help readers see past the short term volatility of the financial market, we aim to bring you a long-term focused research analysis purely driven by fundamental data. Note that our analysis does not factor in the latest price-sensitive company announcements.
The author is an independent contributor and at the time of publication had no position in the stocks mentioned. For errors that warrant correction please contact the editor at editorial-team@simplywallst.com.
