How Has Industrial Services of America, Inc.'s (NASDAQ:IDSA) Performed Against The Industry?

When Industrial Services of America, Inc. (NASDAQ:IDSA) announced its most recent earnings (31 March 2019), I did two things: looked at its past earnings track record, then look at what is happening in the industry. Understanding how Industrial Services of America performed requires a benchmark rather than trying to assess a standalone number at one point in time. Below is a quick commentary on how I see IDSA has performed.
Want to participate in a short research study? Help shape the future of investing tools and you could win a $250 gift card!
View our latest analysis for Industrial Services of America
How Well Did IDSA Perform?
IDSA is loss-making, with the most recent trailing twelve-month earnings of -US$826.0k (from 31 March 2019), which compared to last year has become more negative. However, the company's loss seem to be contracting over the medium term, with the five-year earnings average of -US$6.4m. Each year, for the past five years IDSA has seen an annual decline in revenue of -19%, on average. This adverse movement is a driver of the company's inability to reach breakeven.
Viewing growth from a sector-level, the US commercial services industry has been growing, albeit, at a muted single-digit rate of 5.0% in the past year,
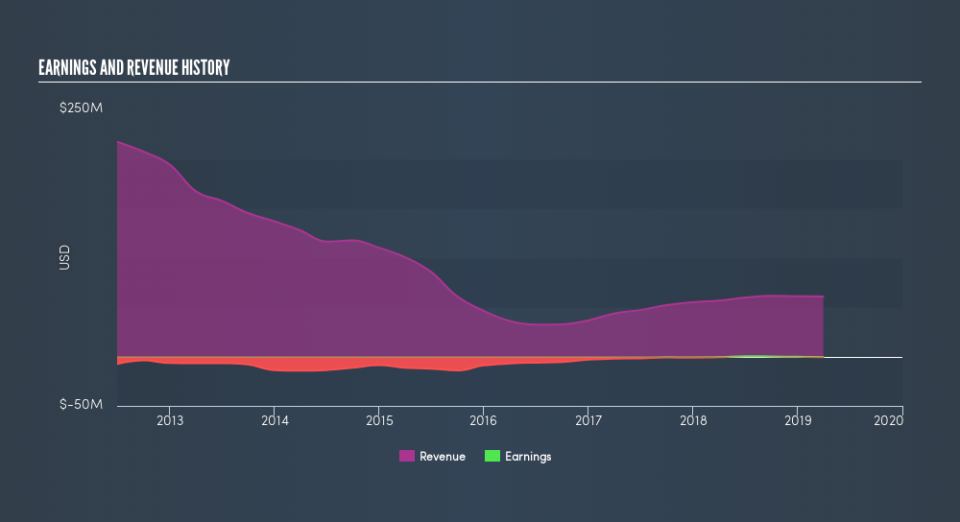
Given that Industrial Services of America is not profitable, even if operating expenses (SG&A and one-year R&D) continues to fall at previous year’s rate of -16%, the company’s current cash level (US$469k) will still be insufficient to cover its expenses in the upcoming year. This is not a great sign in terms of operations and cash management. Even though this is analysis is fairly basic, and Industrial Services of America still can cut its overhead further, or raise debt capital instead of coming to equity markets, the analysis still helps us understand how sustainable the Industrial Services of America’s operation is, and when things may have to change.
What does this mean?
Industrial Services of America's track record can be a valuable insight into its earnings performance, but it certainly doesn't tell the whole story. With companies that are currently loss-making, it is always difficult to envisage what will happen in the future and when. The most insightful step is to assess company-specific issues Industrial Services of America may be facing and whether management guidance has consistently been met in the past. You should continue to research Industrial Services of America to get a better picture of the stock by looking at:
Financial Health: Are IDSA’s operations financially sustainable? Balance sheets can be hard to analyze, which is why we’ve done it for you. Check out our financial health checks here.
Other High-Performing Stocks: Are there other stocks that provide better prospects with proven track records? Explore our free list of these great stocks here.
NB: Figures in this article are calculated using data from the trailing twelve months from 31 March 2019. This may not be consistent with full year annual report figures.
We aim to bring you long-term focused research analysis driven by fundamental data. Note that our analysis may not factor in the latest price-sensitive company announcements or qualitative material.
If you spot an error that warrants correction, please contact the editor at editorial-team@simplywallst.com. This article by Simply Wall St is general in nature. It does not constitute a recommendation to buy or sell any stock, and does not take account of your objectives, or your financial situation. Simply Wall St has no position in the stocks mentioned. Thank you for reading.
