What Is Information Services Group's (NASDAQ:III) P/E Ratio After Its Share Price Rocketed?

Information Services Group (NASDAQ:III) shareholders are no doubt pleased to see that the share price has bounced 37% in the last month alone, although it is still down 14% over the last quarter. But shareholders may not all be feeling jubilant, since the share price is still down 31% in the last year.
All else being equal, a sharp share price increase should make a stock less attractive to potential investors. In the long term, share prices tend to follow earnings per share, but in the short term prices bounce around in response to short term factors (which are not always obvious). The implication here is that deep value investors might steer clear when expectations of a company are too high. Perhaps the simplest way to get a read on investors' expectations of a business is to look at its Price to Earnings Ratio (PE Ratio). A high P/E ratio means that investors have a high expectation about future growth, while a low P/E ratio means they have low expectations about future growth.
Check out our latest analysis for Information Services Group
Does Information Services Group Have A Relatively High Or Low P/E For Its Industry?
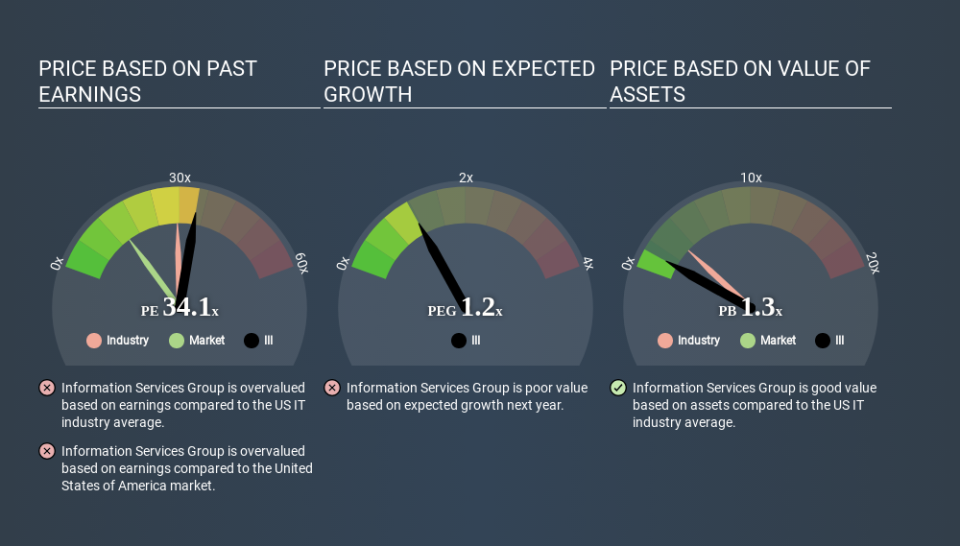
We can tell from its P/E ratio of 34.12 that there is some investor optimism about Information Services Group. As you can see below, Information Services Group has a higher P/E than the average company (29.4) in the it industry.
Information Services Group's P/E tells us that market participants think the company will perform better than its industry peers, going forward. Shareholders are clearly optimistic, but the future is always uncertain. So further research is always essential. I often monitor director buying and selling.
How Growth Rates Impact P/E Ratios
P/E ratios primarily reflect market expectations around earnings growth rates. When earnings grow, the 'E' increases, over time. That means unless the share price increases, the P/E will reduce in a few years. So while a stock may look expensive based on past earnings, it could be cheap based on future earnings.
Information Services Group shrunk earnings per share by 44% over the last year. And over the longer term (5 years) earnings per share have decreased 16% annually. This could justify a pessimistic P/E.
Don't Forget: The P/E Does Not Account For Debt or Bank Deposits
Don't forget that the P/E ratio considers market capitalization. In other words, it does not consider any debt or cash that the company may have on the balance sheet. Hypothetically, a company could reduce its future P/E ratio by spending its cash (or taking on debt) to achieve higher earnings.
Such expenditure might be good or bad, in the long term, but the point here is that the balance sheet is not reflected by this ratio.
So What Does Information Services Group's Balance Sheet Tell Us?
Information Services Group has net debt worth 59% of its market capitalization. This is a reasonably significant level of debt -- all else being equal you'd expect a much lower P/E than if it had net cash.
The Verdict On Information Services Group's P/E Ratio
Information Services Group trades on a P/E ratio of 34.1, which is above its market average of 14.4. With meaningful debt and a lack of recent earnings growth, the market has high expectations that the business will earn more in the future. What is very clear is that the market has become significantly more optimistic about Information Services Group over the last month, with the P/E ratio rising from 24.9 back then to 34.1 today. For those who prefer to invest with the flow of momentum, that might mean it's time to put the stock on a watchlist, or research it. But the contrarian may see it as a missed opportunity.
Investors should be looking to buy stocks that the market is wrong about. People often underestimate remarkable growth -- so investors can make money when fast growth is not fully appreciated. So this free visualization of the analyst consensus on future earnings could help you make the right decision about whether to buy, sell, or hold.
Of course you might be able to find a better stock than Information Services Group. So you may wish to see this free collection of other companies that have grown earnings strongly.
If you spot an error that warrants correction, please contact the editor at editorial-team@simplywallst.com. This article by Simply Wall St is general in nature. It does not constitute a recommendation to buy or sell any stock, and does not take account of your objectives, or your financial situation. Simply Wall St has no position in the stocks mentioned.
We aim to bring you long-term focused research analysis driven by fundamental data. Note that our analysis may not factor in the latest price-sensitive company announcements or qualitative material. Thank you for reading.

