Do Institutions Own A.Plus Group Holdings Limited (HKG:1841) Shares?

Every investor in A.Plus Group Holdings Limited (HKG:1841) should be aware of the most powerful shareholder groups. Generally speaking, as a company grows, institutions will increase their ownership. Conversely, insiders often decrease their ownership over time. Warren Buffett said that he likes 'a business with enduring competitive advantages that is run by able and owner-oriented people'. So it's nice to see some insider ownership, because it may suggest that management is owner-oriented.
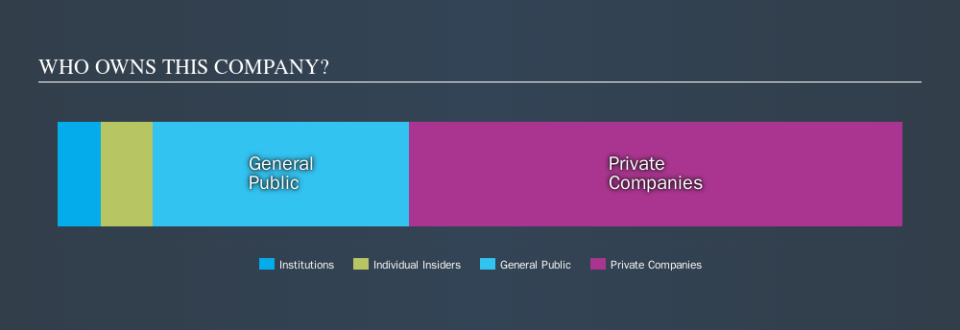
With a market capitalization of HK$232m, A.Plus Group Holdings is a small cap stock, so it might not be well known by many institutional investors. Taking a look at our data on the ownership groups (below), it's seems that institutions are noticeable on the share registry. We can zoom in on the different ownership groups, to learn more about 1841.
View our latest analysis for A.Plus Group Holdings
What Does The Institutional Ownership Tell Us About A.Plus Group Holdings?
Many institutions measure their performance against an index that approximates the local market. So they usually pay more attention to companies that are included in major indices.
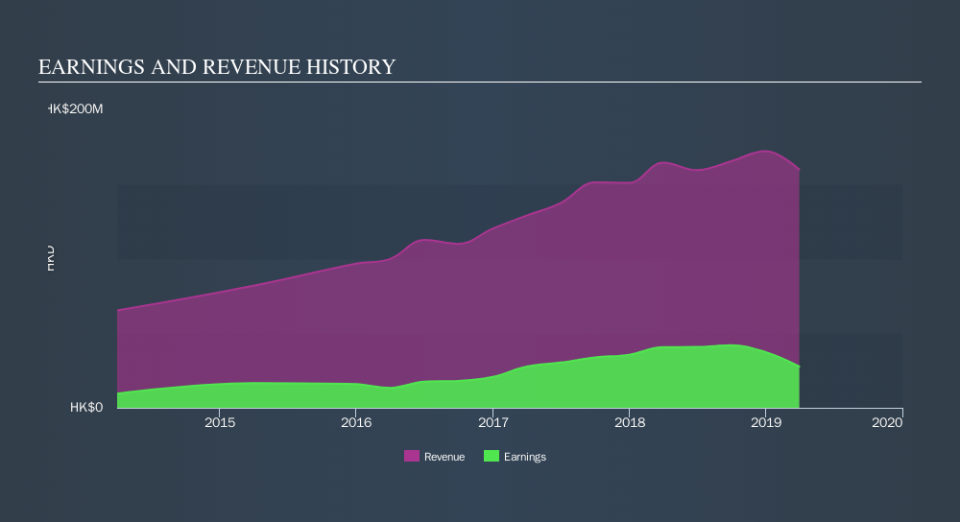
As you can see, institutional investors own 5.2% of A.Plus Group Holdings. This suggests some credibility amongst professional investors. But we can't rely on that fact alone, since institutions make bad investments sometimes, just like everyone does. If multiple institutions change their view on a stock at the same time, you could see the share price drop fast. It's therefore worth looking at A.Plus Group Holdings's earnings history, below. Of course, the future is what really matters.
Hedge funds don't have many shares in A.Plus Group Holdings. We're not picking up on any analyst coverage of the stock at the moment, so the company is unlikely to be widely held.
Insider Ownership Of A.Plus Group Holdings
The definition of company insiders can be subjective, and does vary between jurisdictions. Our data reflects individual insiders, capturing board members at the very least. The company management answer to the board; and the latter should represent the interests of shareholders. Notably, sometimes top-level managers are on the board, themselves.
Insider ownership is positive when it signals leadership are thinking like the true owners of the company. However, high insider ownership can also give immense power to a small group within the company. This can be negative in some circumstances.
Shareholders would probably be interested to learn that insiders own shares in A.Plus Group Holdings Limited. As individuals, the insiders collectively own HK$14m worth of the HK$232m company. This shows at least some alignment, but I usually like to see larger insider holdings. You can click here to see if those insiders have been buying or selling.
General Public Ownership
With a 30% ownership, the general public have some degree of sway over 1841. This size of ownership, while considerable, may not be enough to change company policy if the decision is not in sync with other large shareholders.
Private Company Ownership
Our data indicates that Private Companies hold 58%, of the company's shares. It might be worth looking deeper into this. If related parties, such as insiders, have an interest in one of these private companies, that should be disclosed in the annual report. Private companies may also have a strategic interest in the company.
Next Steps:
While it is well worth considering the different groups that own a company, there are other factors that are even more important.
I always like to check for a history of revenue growth. You can too, by accessing this free chart of historic revenue and earnings in this detailed graph.
Of course this may not be the best stock to buy. So take a peek at this free free list of interesting companies.
NB: Figures in this article are calculated using data from the last twelve months, which refer to the 12-month period ending on the last date of the month the financial statement is dated. This may not be consistent with full year annual report figures.
We aim to bring you long-term focused research analysis driven by fundamental data. Note that our analysis may not factor in the latest price-sensitive company announcements or qualitative material.
If you spot an error that warrants correction, please contact the editor at editorial-team@simplywallst.com. This article by Simply Wall St is general in nature. It does not constitute a recommendation to buy or sell any stock, and does not take account of your objectives, or your financial situation. Simply Wall St has no position in the stocks mentioned. Thank you for reading.
