Do Institutions Own Shares In Alpine Immune Sciences, Inc. (NASDAQ:ALPN)?

Every investor in Alpine Immune Sciences, Inc. (NASDAQ:ALPN) should be aware of the most powerful shareholder groups. Generally speaking, as a company grows, institutions will increase their ownership. Conversely, insiders often decrease their ownership over time. We also tend to see lower insider ownership in companies that were previously publicly owned.
Alpine Immune Sciences is a smaller company with a market capitalization of US$50m, so it may still be flying under the radar of many institutional investors. Our analysis of the ownership of the company, below, shows that institutions own shares in the company. We can zoom in on the different ownership groups, to learn more about ALPN.
View our latest analysis for Alpine Immune Sciences
What Does The Institutional Ownership Tell Us About Alpine Immune Sciences?
Many institutions measure their performance against an index that approximates the local market. So they usually pay more attention to companies that are included in major indices.
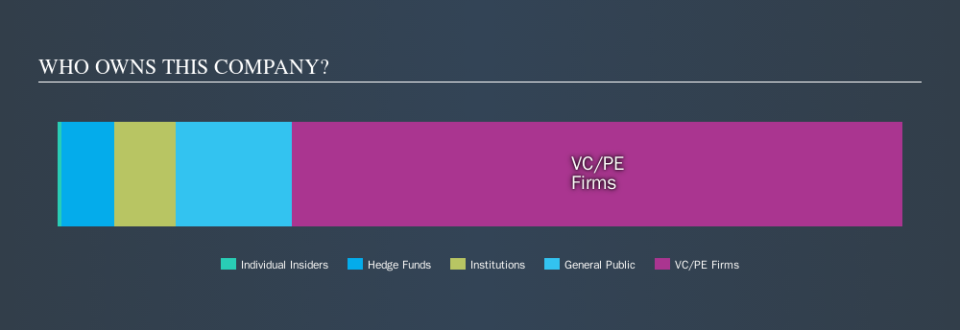
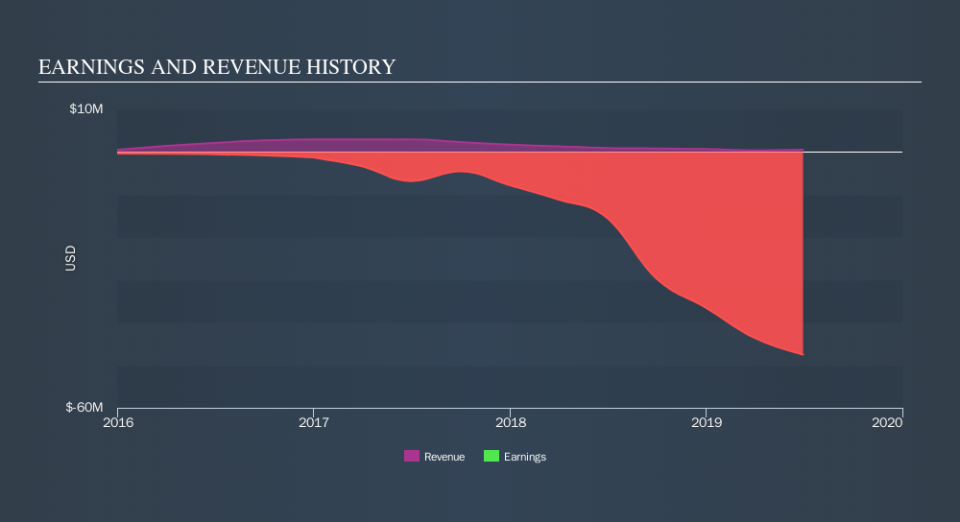
As you can see, institutional investors own 7.3% of Alpine Immune Sciences. This implies the analysts working for those institutions have looked at the stock and they like it. But just like anyone else, they could be wrong. When multiple institutions own a stock, there's always a risk that they are in a 'crowded trade'. When such a trade goes wrong, multiple parties may compete to sell stock fast. This risk is higher in a company without a history of growth. You can see Alpine Immune Sciences's historic earnings and revenue, below, but keep in mind there's always more to the story.
It looks like hedge funds own 6.2% of Alpine Immune Sciences shares. That worth noting, since hedge funds are often quite active investors, who may try to influence management. Many want to see value creation (and a higher share price) in the short term or medium term. Quite a few analysts cover the stock, so you could look into forecast growth quite easily.
Insider Ownership Of Alpine Immune Sciences
While the precise definition of an insider can be subjective, almost everyone considers board members to be insiders. The company management answer to the board; and the latter should represent the interests of shareholders. Notably, sometimes top-level managers are on the board, themselves.
Most consider insider ownership a positive because it can indicate the board is well aligned with other shareholders. However, on some occasions too much power is concentrated within this group.
Our information suggests that Alpine Immune Sciences, Inc. insiders own under 1% of the company. It has a market capitalization of just US$50m, and the board has only US$294k worth of shares in their own names. Many investors in smaller companies prefer to see the board more heavily invested. You can click here to see if those insiders have been buying or selling.
General Public Ownership
The general public, with a 14% stake in the company, will not easily be ignored. While this size of ownership may not be enough to sway a policy decision in their favour, they can still make a collective impact on company policies.
Private Equity Ownership
With an ownership of 72%, private equity firms are in a position to play a role in shaping corporate strategy with a focus on value creation. Some investors might be encouraged by this, since private equity are sometimes able to encourage strategies that help the market see the value in the company. Alternatively, those holders might be exiting the investment after taking it public.
Next Steps:
It's always worth thinking about the different groups who own shares in a company. But to understand Alpine Immune Sciences better, we need to consider many other factors.
I always like to check for a history of revenue growth. You can too, by accessing this free chart of historic revenue and earnings in this detailed graph.
If you would prefer discover what analysts are predicting in terms of future growth, do not miss this free report on analyst forecasts.
NB: Figures in this article are calculated using data from the last twelve months, which refer to the 12-month period ending on the last date of the month the financial statement is dated. This may not be consistent with full year annual report figures.
We aim to bring you long-term focused research analysis driven by fundamental data. Note that our analysis may not factor in the latest price-sensitive company announcements or qualitative material.
If you spot an error that warrants correction, please contact the editor at editorial-team@simplywallst.com. This article by Simply Wall St is general in nature. It does not constitute a recommendation to buy or sell any stock, and does not take account of your objectives, or your financial situation. Simply Wall St has no position in the stocks mentioned. Thank you for reading.
