Interested In Sportscene Group Inc. (CVE:SPS.A)? Here's What Its Recent Performance Looks Like

Examining how Sportscene Group Inc. (TSXV:SPS.A) is performing as a company requires looking at more than just a years' earnings. Below, I will run you through a simple sense check to build perspective on how Sportscene Group is doing by comparing its most recent earnings with its historical trend, in addition to the performance of its hospitality industry peers.
Check out our latest analysis for Sportscene Group
Commentary On SPS.A's Past Performance
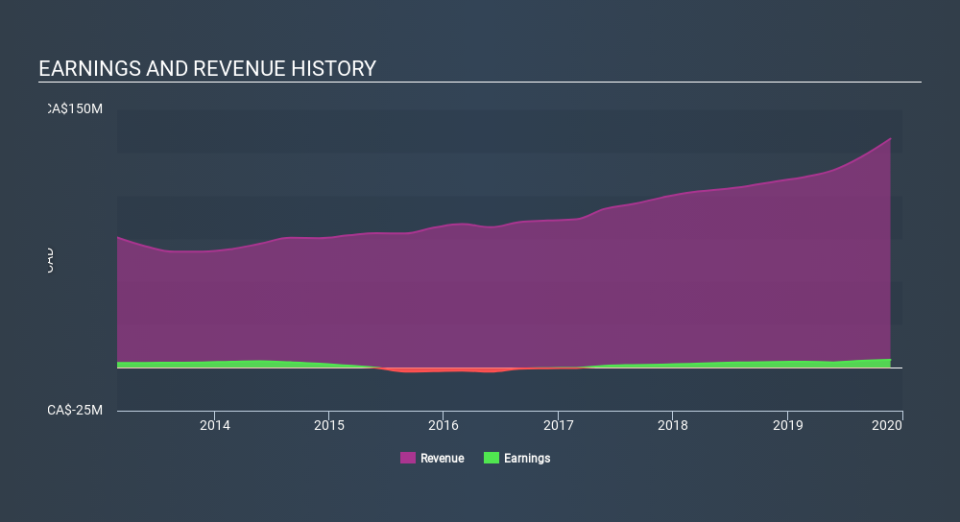
SPS.A's trailing twelve-month earnings (from 24 November 2019) of CA$4.6m has jumped 38% compared to the previous year.
However, this one-year growth rate has been lower than its average earnings growth rate over the past 5 years of 51%, indicating the rate at which SPS.A is growing has slowed down. To understand what's happening, let's look at what's occurring with margins and whether the entire industry is experiencing the hit as well.
In terms of returns from investment, Sportscene Group has fallen short of achieving a 20% return on equity (ROE), recording 11% instead. Furthermore, its return on assets (ROA) of 5.4% is below the CA Hospitality industry of 7.0%, indicating Sportscene Group's are utilized less efficiently. However, its return on capital (ROC), which also accounts for Sportscene Group’s debt level, has increased over the past 3 years from 0.3% to 7.1%. This correlates with a decrease in debt holding, with debt-to-equity ratio declining from 44% to 38% over the past 5 years.
What does this mean?
Though Sportscene Group's past data is helpful, it is only one aspect of my investment thesis. Positive growth and profitability are what investors like to see in a company’s track record, but how do we properly assess sustainability? You should continue to research Sportscene Group to get a more holistic view of the stock by looking at:
Financial Health: Are SPS.A’s operations financially sustainable? Balance sheets can be hard to analyze, which is why we’ve done it for you. Check out our financial health checks here.
Valuation: What is SPS.A worth today? Is the stock undervalued, even when its growth outlook is factored into its intrinsic value? The intrinsic value infographic in our free research report helps visualize whether SPS.A is currently mispriced by the market.
Other High-Performing Stocks: Are there other stocks that provide better prospects with proven track records? Explore our free list of these great stocks here.
NB: Figures in this article are calculated using data from the trailing twelve months from 24 November 2019. This may not be consistent with full year annual report figures.
If you spot an error that warrants correction, please contact the editor at editorial-team@simplywallst.com. This article by Simply Wall St is general in nature. It does not constitute a recommendation to buy or sell any stock, and does not take account of your objectives, or your financial situation. Simply Wall St has no position in the stocks mentioned.
We aim to bring you long-term focused research analysis driven by fundamental data. Note that our analysis may not factor in the latest price-sensitive company announcements or qualitative material. Thank you for reading.
