Are Intred S.p.A.’s (BIT:ITD) High Returns Really That Great?

Today we are going to look at Intred S.p.A. (BIT:ITD) to see whether it might be an attractive investment prospect. To be precise, we'll consider its Return On Capital Employed (ROCE), as that will inform our view of the quality of the business.
First of all, we'll work out how to calculate ROCE. Second, we'll look at its ROCE compared to similar companies. Then we'll determine how its current liabilities are affecting its ROCE.
What is Return On Capital Employed (ROCE)?
ROCE is a measure of a company's yearly pre-tax profit (its return), relative to the capital employed in the business. In general, businesses with a higher ROCE are usually better quality. Ultimately, it is a useful but imperfect metric. Renowned investment researcher Michael Mauboussin has suggested that a high ROCE can indicate that 'one dollar invested in the company generates value of more than one dollar'.
So, How Do We Calculate ROCE?
Analysts use this formula to calculate return on capital employed:
Return on Capital Employed = Earnings Before Interest and Tax (EBIT) ÷ (Total Assets - Current Liabilities)
Or for Intred:
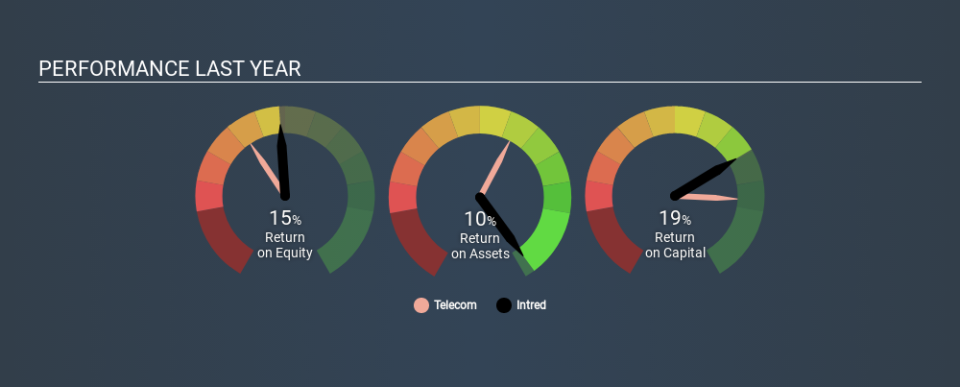
0.19 = €5.0m ÷ (€39m - €13m) (Based on the trailing twelve months to June 2019.)
Therefore, Intred has an ROCE of 19%.
See our latest analysis for Intred
Does Intred Have A Good ROCE?
ROCE can be useful when making comparisons, such as between similar companies. In our analysis, Intred's ROCE is meaningfully higher than the 9.0% average in the Telecom industry. We consider this a positive sign, because it suggests it uses capital more efficiently than similar companies. Regardless of where Intred sits next to its industry, its ROCE in absolute terms appears satisfactory, and this company could be worth a closer look.
You can click on the image below to see (in greater detail) how Intred's past growth compares to other companies.
Remember that this metric is backwards looking - it shows what has happened in the past, and does not accurately predict the future. ROCE can be deceptive for cyclical businesses, as returns can look incredible in boom times, and terribly low in downturns. This is because ROCE only looks at one year, instead of considering returns across a whole cycle. How cyclical is Intred? You can see for yourself by looking at this free graph of past earnings, revenue and cash flow.
Intred's Current Liabilities And Their Impact On Its ROCE
Liabilities, such as supplier bills and bank overdrafts, are referred to as current liabilities if they need to be paid within 12 months. Due to the way the ROCE equation works, having large bills due in the near term can make it look as though a company has less capital employed, and thus a higher ROCE than usual. To counter this, investors can check if a company has high current liabilities relative to total assets.
Intred has total liabilities of €13m and total assets of €39m. As a result, its current liabilities are equal to approximately 32% of its total assets. With this level of current liabilities, Intred's ROCE is boosted somewhat.
Our Take On Intred's ROCE
With a decent ROCE, the company could be interesting, but remember that the level of current liabilities make the ROCE look better. Intred looks strong on this analysis, but there are plenty of other companies that could be a good opportunity . Here is a free list of companies growing earnings rapidly.
For those who like to find winning investments this free list of growing companies with recent insider purchasing, could be just the ticket.
If you spot an error that warrants correction, please contact the editor at editorial-team@simplywallst.com. This article by Simply Wall St is general in nature. It does not constitute a recommendation to buy or sell any stock, and does not take account of your objectives, or your financial situation. Simply Wall St has no position in the stocks mentioned.
We aim to bring you long-term focused research analysis driven by fundamental data. Note that our analysis may not factor in the latest price-sensitive company announcements or qualitative material. Thank you for reading.
