Introducing Grand Gulf Energy (ASX:GGE), The Stock That Slid 70% In The Last Five Years

Grand Gulf Energy Limited (ASX:GGE) shareholders should be happy to see the share price up 20% in the last week. But that doesn't change the fact that the returns over the last five years have been less than pleasing. You would have done a lot better buying an index fund, since the stock has dropped 70% in that half decade.
Check out our latest analysis for Grand Gulf Energy
With just AU$3,034,440 worth of revenue in twelve months, we don't think the market considers Grand Gulf Energy to have proven its business plan. We can't help wondering why it's publicly listed so early in its journey. Are venture capitalists not interested? As a result, we think it's unlikely shareholders are paying much attention to current revenue, but rather speculating on growth in the years to come. It seems likely some shareholders believe that Grand Gulf Energy will discover or develop fossil fuel before too long.
We think companies that have neither significant revenues nor profits are pretty high risk. There is usually a significant chance that they will need more money for business development, putting them at the mercy of capital markets. So the share price itself impacts the value of the shares (as it determines the cost of capital). While some companies like this go on to deliver on their plan, making good money for shareholders, many end in painful losses and eventual de-listing. Grand Gulf Energy has already given some investors a taste of the bitter losses that high risk investing can cause.
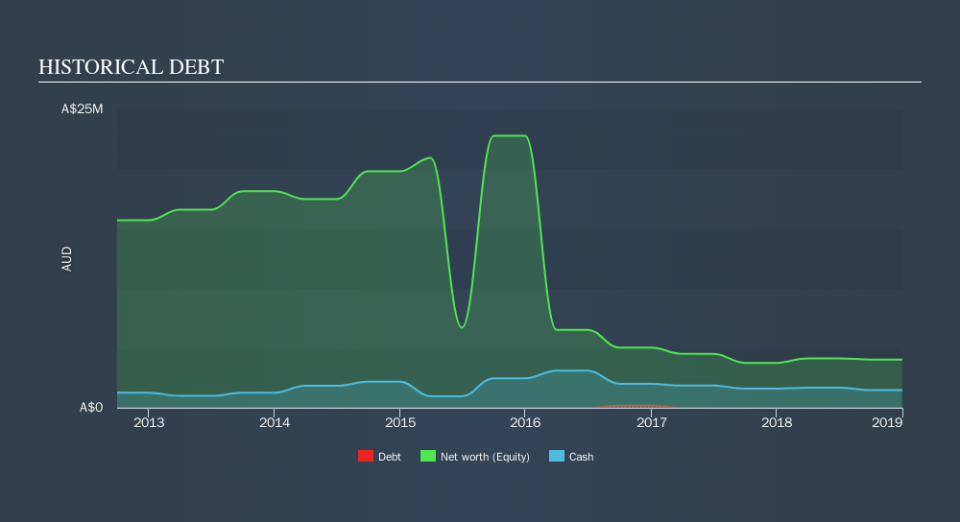
Grand Gulf Energy has plenty of cash in the bank, with cash in excess of all liabilities sitting at AU$1.1m, when it last reported (December 2018). This gives management the flexibility to drive business growth, without worrying too much about cash reserves. But with the share price diving 21% per year, over 5 years , it could be that the price was previously too hyped up. The image below shows how Grand Gulf Energy's balance sheet has changed over time; if you want to see the precise values, simply click on the image. You can see in the image below, how Grand Gulf Energy's cash levels have changed over time (click to see the values).
Of course, the truth is that it is hard to value companies without much revenue or profit. Given that situation, would you be concerned if it turned out insiders were relentlessly selling stock? I'd like that just about as much as I like to drink milk and fruit juice mixed together. It costs nothing but a moment of your time to see if we are picking up on any insider selling.
What about the Total Shareholder Return (TSR)?
We'd be remiss not to mention the difference between Grand Gulf Energy's total shareholder return (TSR) and its share price return. Arguably the TSR is a more complete return calculation because it accounts for the value of dividends (as if they were reinvested), along with the hypothetical value of any discounted capital that have been offered to shareholders. We note that Grand Gulf Energy's TSR, at -49% is higher than its share price return of -70%. When you consider it hasn't been paying a dividend, this data suggests shareholders have benefitted from a spin-off, or had the opportunity to acquire attractively priced shares in a discounted capital raising.
A Different Perspective
It's good to see that Grand Gulf Energy has rewarded shareholders with a total shareholder return of 29% in the last twelve months. There's no doubt those recent returns are much better than the TSR loss of 12% per year over five years. The long term loss makes us cautious, but the short term TSR gain certainly hints at a brighter future. Most investors take the time to check the data on insider transactions. You can click here to see if insiders have been buying or selling.
Of course, you might find a fantastic investment by looking elsewhere. So take a peek at this free list of companies we expect will grow earnings.
Please note, the market returns quoted in this article reflect the market weighted average returns of stocks that currently trade on AU exchanges.
We aim to bring you long-term focused research analysis driven by fundamental data. Note that our analysis may not factor in the latest price-sensitive company announcements or qualitative material.
If you spot an error that warrants correction, please contact the editor at editorial-team@simplywallst.com. This article by Simply Wall St is general in nature. It does not constitute a recommendation to buy or sell any stock, and does not take account of your objectives, or your financial situation. Simply Wall St has no position in the stocks mentioned. Thank you for reading.
