Investors in Erie Indemnity (NASDAQ:ERIE) have made a respectable return of 58% over the past five years
While Erie Indemnity Company (NASDAQ:ERIE) shareholders are probably generally happy, the stock hasn't had particularly good run recently, with the share price falling 10% in the last quarter. But at least the stock is up over the last five years. In that time, it is up 40%, which isn't bad, but is below the market return of 74%. While the long term returns are impressive, we do have some sympathy for those who bought more recently, given the 18% drop, in the last year.
So let's investigate and see if the longer term performance of the company has been in line with the underlying business' progress.
See our latest analysis for Erie Indemnity
To paraphrase Benjamin Graham: Over the short term the market is a voting machine, but over the long term it's a weighing machine. One flawed but reasonable way to assess how sentiment around a company has changed is to compare the earnings per share (EPS) with the share price.
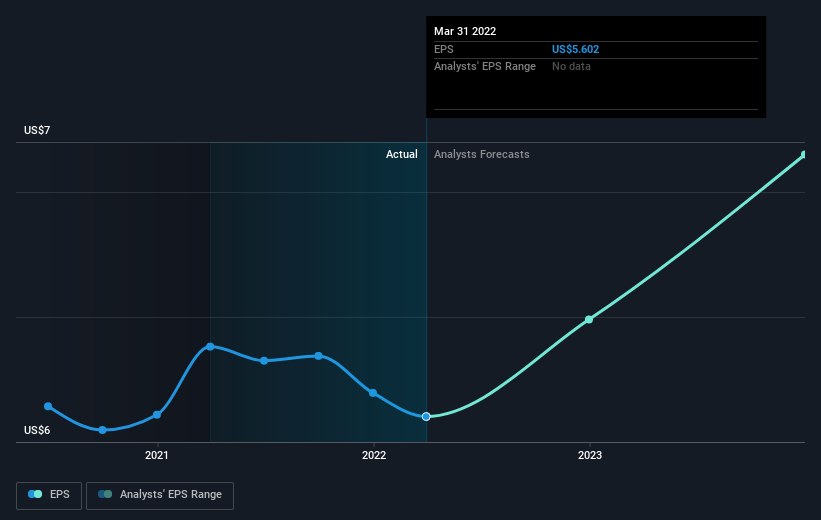
Over half a decade, Erie Indemnity managed to grow its earnings per share at 6.6% a year. This EPS growth is remarkably close to the 7% average annual increase in the share price. Therefore one could conclude that sentiment towards the shares hasn't morphed very much. Indeed, it would appear the share price is reacting to the EPS.
You can see below how EPS has changed over time (discover the exact values by clicking on the image).
It's probably worth noting that the CEO is paid less than the median at similar sized companies. It's always worth keeping an eye on CEO pay, but a more important question is whether the company will grow earnings throughout the years. This free interactive report on Erie Indemnity's earnings, revenue and cash flow is a great place to start, if you want to investigate the stock further.
What About Dividends?
As well as measuring the share price return, investors should also consider the total shareholder return (TSR). The TSR is a return calculation that accounts for the value of cash dividends (assuming that any dividend received was reinvested) and the calculated value of any discounted capital raisings and spin-offs. Arguably, the TSR gives a more comprehensive picture of the return generated by a stock. We note that for Erie Indemnity the TSR over the last 5 years was 58%, which is better than the share price return mentioned above. And there's no prize for guessing that the dividend payments largely explain the divergence!
A Different Perspective
We regret to report that Erie Indemnity shareholders are down 16% for the year (even including dividends). Unfortunately, that's worse than the broader market decline of 12%. Having said that, it's inevitable that some stocks will be oversold in a falling market. The key is to keep your eyes on the fundamental developments. Longer term investors wouldn't be so upset, since they would have made 10%, each year, over five years. If the fundamental data continues to indicate long term sustainable growth, the current sell-off could be an opportunity worth considering. While it is well worth considering the different impacts that market conditions can have on the share price, there are other factors that are even more important. For example, we've discovered 2 warning signs for Erie Indemnity that you should be aware of before investing here.
If you are like me, then you will not want to miss this free list of growing companies that insiders are buying.
Please note, the market returns quoted in this article reflect the market weighted average returns of stocks that currently trade on US exchanges.
Have feedback on this article? Concerned about the content? Get in touch with us directly. Alternatively, email editorial-team (at) simplywallst.com.
This article by Simply Wall St is general in nature. We provide commentary based on historical data and analyst forecasts only using an unbiased methodology and our articles are not intended to be financial advice. It does not constitute a recommendation to buy or sell any stock, and does not take account of your objectives, or your financial situation. We aim to bring you long-term focused analysis driven by fundamental data. Note that our analysis may not factor in the latest price-sensitive company announcements or qualitative material. Simply Wall St has no position in any stocks mentioned.

