What Investors Should Know About Illumina, Inc.’s (NASDAQ:ILMN) Financial Strength

Want to participate in a short research study? Help shape the future of investing tools and receive a $20 prize!
Investors pursuing a solid, dependable stock investment can often be led to Illumina, Inc. (NASDAQ:ILMN), a large-cap worth US$44b. Risk-averse investors who are attracted to diversified streams of revenue and strong capital returns tend to seek out these large companies. But, the health of the financials determines whether the company continues to succeed. Today we will look at Illumina’s financial liquidity and debt levels, which are strong indicators for whether the company can weather economic downturns or fund strategic acquisitions for future growth. Note that this commentary is very high-level and solely focused on financial health, so I suggest you dig deeper yourself into ILMN here.
Check out our latest analysis for Illumina
How does ILMN’s operating cash flow stack up against its debt?
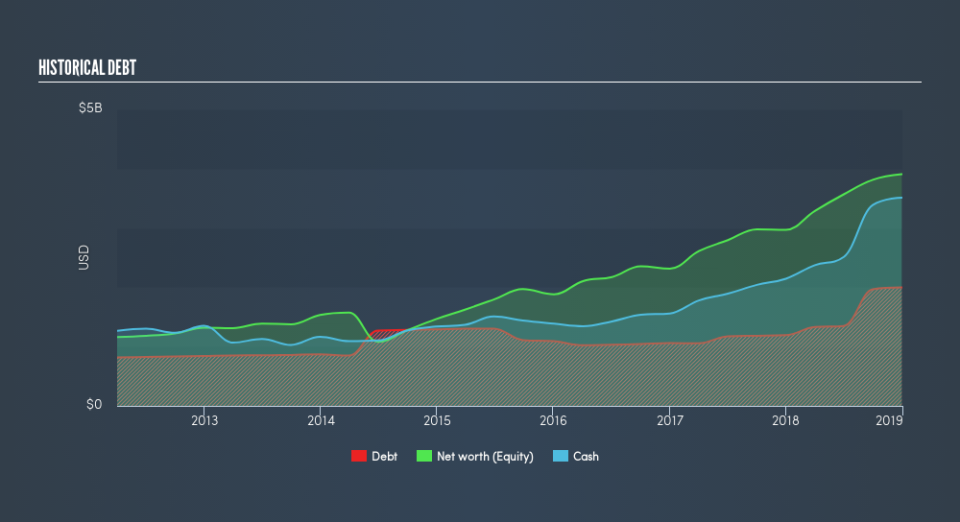
Over the past year, ILMN has ramped up its debt from US$1.2b to US$2.0b – this includes long-term debt. With this increase in debt, the current cash and short-term investment levels stands at US$3.5b for investing into the business. Moreover, ILMN has generated US$1.1b in operating cash flow during the same period of time, resulting in an operating cash to total debt ratio of 57%, meaning that ILMN’s current level of operating cash is high enough to cover debt. This ratio can also be a sign of operational efficiency as an alternative to return on assets. In ILMN’s case, it is able to generate 0.57x cash from its debt capital.
Does ILMN’s liquid assets cover its short-term commitments?
With current liabilities at US$1.8b, it seems that the business has been able to meet these obligations given the level of current assets of US$4.5b, with a current ratio of 2.49x. For Life Sciences companies, this ratio is within a sensible range as there’s enough of a cash buffer without holding too much capital in low return investments.
Can ILMN service its debt comfortably?
With a debt-to-equity ratio of 51%, ILMN can be considered as an above-average leveraged company. This is common amongst large-cap companies because debt can often be a less expensive alternative to equity due to tax deductibility of interest payments. Since large-caps are seen as safer than their smaller constituents, they tend to enjoy lower cost of capital. No matter how high the company’s debt, if it can easily cover the interest payments, it’s considered to be efficient with its use of excess leverage. Net interest should be covered by earnings before interest and tax (EBIT) by at least three times to be safe. In ILMN’s case, the ratio of 67.92x suggests that interest is amply covered. It is considered a responsible and reassuring practice to maintain high interest coverage, which makes ILMN and other large-cap investments thought to be safe.
Next Steps:
ILMN’s high cash coverage means that, although its debt levels are high, the company is able to utilise its borrowings efficiently in order to generate cash flow. Since there is also no concerns around ILMN’s liquidity needs, this may be its optimal capital structure for the time being. This is only a rough assessment of financial health, and I’m sure ILMN has company-specific issues impacting its capital structure decisions. I suggest you continue to research Illumina to get a better picture of the large-cap by looking at:
Future Outlook: What are well-informed industry analysts predicting for ILMN’s future growth? Take a look at our free research report of analyst consensus for ILMN’s outlook.
Valuation: What is ILMN worth today? Is the stock undervalued, even when its growth outlook is factored into its intrinsic value? The intrinsic value infographic in our free research report helps visualize whether ILMN is currently mispriced by the market.
Other High-Performing Stocks: Are there other stocks that provide better prospects with proven track records? Explore our free list of these great stocks here.
We aim to bring you long-term focused research analysis driven by fundamental data. Note that our analysis may not factor in the latest price-sensitive company announcements or qualitative material.
If you spot an error that warrants correction, please contact the editor at editorial-team@simplywallst.com. This article by Simply Wall St is general in nature. It does not constitute a recommendation to buy or sell any stock, and does not take account of your objectives, or your financial situation. Simply Wall St has no position in the stocks mentioned. Thank you for reading.

