Investors one-year returns in Lloyds Banking Group (LON:LLOY) have grown faster than the company's underlying earnings growth
These days it's easy to simply buy an index fund, and your returns should (roughly) match the market. But one can do better than that by picking better than average stocks (as part of a diversified portfolio). To wit, the Lloyds Banking Group plc (LON:LLOY) share price is 23% higher than it was a year ago, much better than the market return of around 12% (not including dividends) in the same period. If it can keep that out-performance up over the long term, investors will do very well! Unfortunately the longer term returns are not so good, with the stock falling 17% in the last three years.
In light of the stock dropping 6.2% in the past week, we want to investigate the longer term story, and see if fundamentals have been the driver of the company's positive one-year return.
See our latest analysis for Lloyds Banking Group
To quote Buffett, 'Ships will sail around the world but the Flat Earth Society will flourish. There will continue to be wide discrepancies between price and value in the marketplace...' By comparing earnings per share (EPS) and share price changes over time, we can get a feel for how investor attitudes to a company have morphed over time.
During the last year Lloyds Banking Group saw its earnings per share (EPS) increase strongly. We don't think the exact number is a good guide to the sustainable growth rate, but we do think this sort of increase is impressive. We are not surprised the share price is up. Strong growth like this can be evidence of a fundamental inflection point in the business, making it a good time to investigate the stock more closely.
You can see below how EPS has changed over time (discover the exact values by clicking on the image).
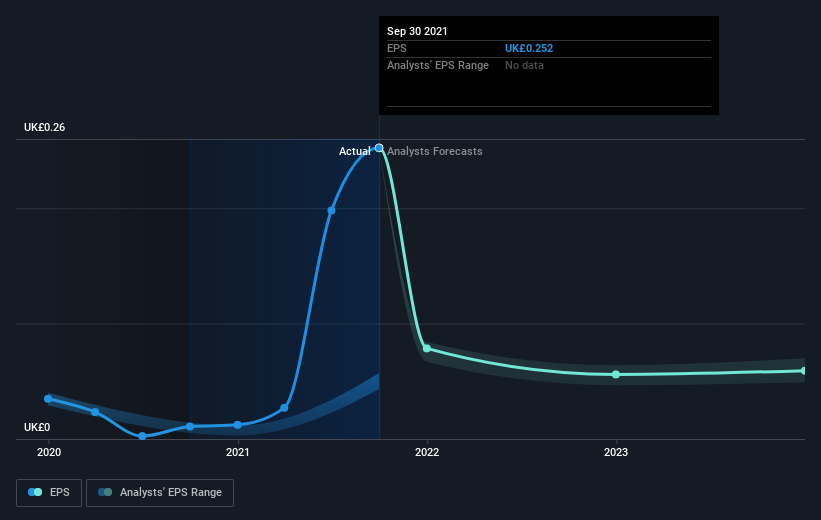
It's probably worth noting we've seen significant insider buying in the last quarter, which we consider a positive. That said, we think earnings and revenue growth trends are even more important factors to consider. Dive deeper into the earnings by checking this interactive graph of Lloyds Banking Group's earnings, revenue and cash flow.
What About Dividends?
As well as measuring the share price return, investors should also consider the total shareholder return (TSR). Whereas the share price return only reflects the change in the share price, the TSR includes the value of dividends (assuming they were reinvested) and the benefit of any discounted capital raising or spin-off. Arguably, the TSR gives a more comprehensive picture of the return generated by a stock. In the case of Lloyds Banking Group, it has a TSR of 27% for the last 1 year. That exceeds its share price return that we previously mentioned. The dividends paid by the company have thusly boosted the total shareholder return.
A Different Perspective
It's nice to see that Lloyds Banking Group shareholders have received a total shareholder return of 27% over the last year. And that does include the dividend. Notably the five-year annualised TSR loss of 0.8% per year compares very unfavourably with the recent share price performance. The long term loss makes us cautious, but the short term TSR gain certainly hints at a brighter future. While it is well worth considering the different impacts that market conditions can have on the share price, there are other factors that are even more important. Take risks, for example - Lloyds Banking Group has 3 warning signs (and 1 which is a bit unpleasant) we think you should know about.
Lloyds Banking Group is not the only stock insiders are buying. So take a peek at this free list of growing companies with insider buying.
Please note, the market returns quoted in this article reflect the market weighted average returns of stocks that currently trade on GB exchanges.
This article by Simply Wall St is general in nature. We provide commentary based on historical data and analyst forecasts only using an unbiased methodology and our articles are not intended to be financial advice. It does not constitute a recommendation to buy or sell any stock, and does not take account of your objectives, or your financial situation. We aim to bring you long-term focused analysis driven by fundamental data. Note that our analysis may not factor in the latest price-sensitive company announcements or qualitative material. Simply Wall St has no position in any stocks mentioned.
Have feedback on this article? Concerned about the content? Get in touch with us directly. Alternatively, email editorial-team (at) simplywallst.com.

